Modbus Monitor XPF - User Guide
A practical guide for controls engineers and technicians
1. Introduction
Modbus Monitor XPF is a versatile Windows application for facilitating communication between a Windows-based PC and Modbus devices. It combines Client (Master), Server (Slave), and HMI dashboard functionality in one workflow and supports all common Modbus variants: TCP/IP, Serial RTU, Serial ASCII, and RTU/ASCII over TCP.
One of the standout features of Modbus Monitor XPF is its triple functionality - it brings together a Modbus Client, a Modbus Server, and an HMI dashboard environment within a single application, running together. This combined capability, with support for both Modbus Serial and Modbus TCP protocols, makes it an invaluable tool for commissioning, simulation, and real-time operator visualization.
What you can do with it:
- Monitor live data from PLCs, drives, meters, and other Modbus devices (Client Mode)
- Write values to registers and coils for testing or control (Monitor Points Configuration)
- Simulate Modbus devices for testing your own equipment (Server Mode)
- Build and run HMI dashboards for live operator views and controls (HMI Tab and Widgets)
- Scan unknown devices to discover their register maps (Scanner Group)
- Log data for analysis and troubleshooting (Log Group)
- Validate register values against expected ranges (Evaluate Group)
- Run Client, Server, and HMI workflows together on one PC
Who this is for:
- Controls engineers commissioning systems
- Maintenance technicians troubleshooting communications
- System integrators testing device compatibility
- Equipment manufacturers validating Modbus implementations
- SCADA developers needing device simulation without physical hardware
What Makes This Different
Most Modbus tools are either simple monitors or complex SCADA packages. XPF sits in the middle - it's powerful enough for serious work but simple enough to use quickly. The key advantages:
- Runs Client, Server, and HMI together - Test communications and visualize data in one application
- Pre-built device maps - Download factory-validated maps or community-contributed maps for common equipment (see Modbus Device Maps Start Page)
- Built-in data validation - Automatic pass/fail testing with color coding
- Professional logging - Proper timestamped records for troubleshooting
- Cross-platform protocol support - Mix Modbus TCP, RTU, ASCII in the same session
Learning Resources
Beyond this user guide, additional resources are available:
- YouTube Tutorials - Short demonstrations of features and workflows
- Online Help - Comprehensive web-based documentation
- Community Forum - User discussions and troubleshooting help
- Modbus Device Maps Start Page - Browse manufacturer/model map previews before importing maps in XPF
2. Installation & Activation
System Requirements
Minimum Requirements:
- Windows 10 or 11 (64-bit recommended)
- .NET Framework 4.8 or later
- 4GB RAM minimum, 8GB recommended
- 100-500 MB free disk space
- Serial ports (USB-to-serial adapters work fine)
- Network access for TCP/IP communications
| Component | Minimum | Recommended | Notes |
|---|---|---|---|
| OS | Windows 10 x64 | Windows 11 x64 | Most modern systems |
| RAM | 4 GB | 8 GB+ | More memory = better performance |
| Storage | 100 MB | 500 MB | Depends on log file size |
| .NET | Framework 4.8+ | Latest Version | Usually pre-installed |
| Ports | USB or Ethernet | Multiple adapters | For Modbus connections |
| Component | Minimum | Recommended | Notes |
|---|---|---|---|
| OS | Windows 10 x86 | Windows 11 x86 | Older or embedded systems |
| RAM | 2 GB | 4 GB | 32-bit limit is ~3.5 GB total |
| Storage | 100 MB | 200 MB | Smaller footprint |
| .NET | Framework 4.8+ | Latest Version | Same as 64-bit |
| Ports | USB or Ethernet | Multiple adapters | Full feature compatibility |
Recommended for field work:
- Rugged laptop with Windows 10/11
- USB-to-serial adapter (FTDI chipset recommended)
- Ethernet port for Modbus TCP
- 8GB RAM for smooth operation
- Portable version - No installation needed, runs from USB drive
Field Technician Tip
Keep the portable version on a USB drive alongside your serial adapters. You can run it on any Windows machine without installation rights.
Getting the Software
Install via Microsoft Store - Easiest Method
Search for "Modbus Monitor XPF" directly in the Microsoft Store on your Windows Desktop. Once installed, the application can be accessed from the Start Menu.
Benefits: - Automatic updates and license management - No admin rights needed for installation - Universal binary - Works on both 32-bit and 64-bit Windows - License per user (not per machine) - follows your Microsoft Account - Automatic cloud licensing - Purchase and activate through Store
Or visit the web store: Microsoft Store Product Page
Install from QuantumBit Solutions Downloads Page
Download the latest version of Modbus Monitor XPF directly from our Downloads Page. This page provides all available versions, including portable and installer options for ARM64, x64, and x86 architectures.
- **Installer**: Creates shortcuts, integrates with Windows, faster startup
- **Portable**: No installation needed, run from USB drives, good for field work
- **ARM64**: For Windows on ARM devices (Surface Pro X, etc.)
- **64-bit**: Works on modern Windows (2010+), handles large datasets better
- **32-bit**: Only needed for older Windows systems or embedded PCs
Recommendation
For most users, the 64-bit version is recommended for modern systems. Portable versions are ideal for field work or systems without admin rights.
Volume licensing and site deployments
- Multiple machine licenses available
- Offline licensing for air-gapped networks
- Volume discounts for large deployments
- Purchase orders and invoice billing accepted
Which Version Should I Choose?
Most users: Choose the 64-bit version - it works on modern Windows systems and handles large datasets better.
Use 32-bit version if: - Running on older Windows systems (pre-2010) - Using embedded/industrial PCs with 32-bit OS - Company policy requires 32-bit applications
Installer vs Portable: - Installer: Better for permanent desk setups, adds shortcuts and file associations - Portable: Better for field work, USB drives, or systems without admin rights
License Activation
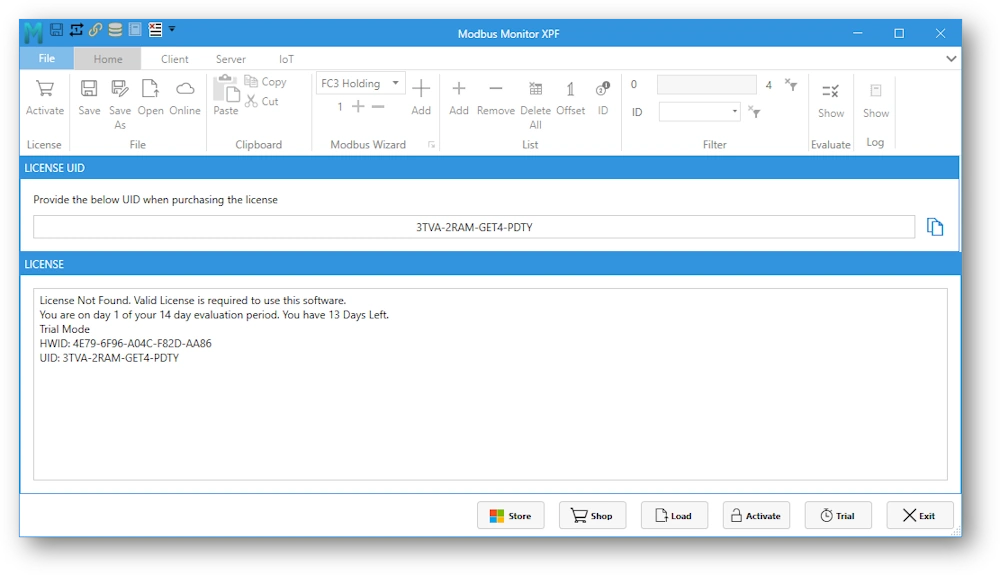
This section walks you through activating the license for your Modbus Monitor XPF software. The License window provides several buttons and fields to help you navigate the activation process.
First Launch Experience:
When you launch Modbus Monitor XPF for the first time, the License window appears automatically. This window displays:
- UID (User Identification) - Your unique identifier for license purchases
- License Information Panel - Shows current license status (Trial or Licensed)
- Hardware ID (HWID) - Used for certain license types
- Licensing Buttons - Store, Shop, Activate, Load, Trial, Exit
Licensing Buttons Overview:
| Button | Purpose | When to Use |
|---|---|---|
| Store | Microsoft Store purchase & activation | Purchase through Microsoft Store or activate Store license |
| Shop | Online shop page | Opens web browser to quantumbitsolutions.com/shop |
| Activate | Enter license key | After purchasing online key-based license |
| Load | Load license file | For .lic files (enterprise/offline licenses) |
| Trial | Start trial mode | Begin evaluation period with full features |
| Exit | Close license window | Exit the application |
Trial Version - Full Featured Evaluation
Free trial with ALL features unlocked - No credit card required. Perfect for testing before purchase.
Starting Trial Mode: 1. Launch XPF for the first time 2. License window appears automatically 3. Click "Trial" button to begin evaluation period 4. License Information Panel shows how many days are left in your evaluation period 5. Start using the application immediately with limited functionality. Runtime and some features are restricted and requires full license.
Main Steps to Activate the Software:
- Purchase License - Click "Store" or "Shop" button to visit licensing store and complete purchase
- Load or Enter Key - After purchase, load license file (enterprise) or enter license key (online purchase)
- Verify Activation - License Information Panel confirms activation status and trial mode is disabled
Choose your activation method based on how you obtained the software:
Automatic activation with Microsoft Account
The Microsoft Store version handles licensing automatically - no manual activation needed!
Purchase & Activation Flow:
- Open License Window
- Launch Modbus Monitor XPF
- The license dialog appears automatically on first launch
-
Or go to File Tab → About → Activate button
-
Click "Store" Button
- Opens Microsoft Store purchase page
-
Your UID is automatically included in the purchase
-
Complete Purchase
- Sign in with your Microsoft Account
- Complete payment in the Microsoft Store
-
Purchase is linked to your Microsoft Account
-
Activate License
- Return to XPF License window
- Click "Store" button again to activate
- System verifies purchase with Microsoft
- Status changes to "Licensed" immediately
Benefits:
- No manual license key entry required
- Automatic renewal options available
- License tied to Microsoft Account (not individual PC)
- Easy reinstallation on any Windows device
- Can be used on new computers with same Microsoft Account
Multi-Computer Usage
Microsoft Store licenses follow your Microsoft Account. Install on multiple devices and sign in with the same account - the Store button activates on each installation automatically!
License Window Location
Access the license window through: File Tab → About section → Activate button
Manual activation with license key
For licenses purchased directly from quantumbitsolutions.com using online Shop or purchase buttons.
Step-by-Step Activation:
- Get Your UID (BEFORE Purchasing!)
- Launch Modbus Monitor XPF
- Go to File Tab → About → Activate button
- License window opens showing your UID (User Identification)
- Format looks like:
ABC123-DEF456-GHI789or similar alphanumeric code - Click "Copy" button next to the UID field
-
Save this UID - it's required for purchasing your license
-
Purchase License Online
- Click the "Shop" button in the License window (opens shop page)
- Or visit quantumbitsolutions.com/shop directly
- Select Modbus Monitor XPF license
- Enter your UID in the order form (critical step!)
-
Complete payment through the online system
-
Receive License Key via Email
- Check your email inbox (usually arrives within minutes)
- License key format:
XXXX-XXXX-XXXX-XXXX-XXXX(5 groups separated by dashes) - Save this email - you'll need it for reinstallation on other computers
-
Note: Key is permanently tied to your UID
-
Activate in XPF
- Return to the License window (File Tab → About → Activate)
- Click "Activate" button in the Licensing Buttons section
- Paste your complete license key in the entry field
- System verifies the key online
- License Information Panel updates to show "Licensed" status
Critical: Provide UID When Purchasing!
Your license key is permanently bound to your UID. If you purchase without providing your UID, the key won't work and you'll need to contact support for a replacement key.
License Window Components:
| Component | Description |
|---|---|
| UID Field | Displays your unique User Identification code |
| Copy Button | Copies UID to clipboard for purchase form |
| License Information Panel | Shows current license status (Trial or Licensed) |
| Activate Button | Opens field to enter license key for activation |
| Shop Button | Opens online shop to purchase license |
Troubleshooting:
- "Invalid Key" error: Verify you copied the entire key including all dashes, no extra spaces
- "UID Mismatch": Key was purchased for different UID - contact support with both UID and key
- "Connection Error": Activation requires internet connection - check firewall settings
- Key not working: Ensure you're entering the key in the Activate dialog, not the Trial field
License file for multiple installations or air-gapped systems
For organizations needing multiple installations, offline activation, or centralized license management.
License Types:
| License Type | Use Case | Activation Method |
|---|---|---|
| Site License | Multiple PCs at one location | License file (.lic) or keys |
| Volume License | Many installations, any location | Multiple keys or license files |
| Offline License | Air-gapped networks, no internet | Special license file only |
| OEM License | Bundled with equipment | Custom activation method |
Activation with License File (.lic):
- Contact Sales for Enterprise Licensing
- Email sales@quantumbitsolutions.com
- Provide: Number of seats needed, deployment location(s), offline requirements
- Discuss: Site license, volume pricing, offline activation needs
-
Receive: Quote and purchase order details
-
Receive License File
- Sales team provides special
.liclicense file after purchase - File contains all activation data embedded
- No internet connection required for activation with license file
-
Can be used on multiple PCs (based on license terms)
-
Load License File on Each Computer
- Launch Modbus Monitor XPF
- Open License window: File Tab → About → Activate
- Click "Load" button in the Licensing Buttons section
- File browser opens
- Navigate to your
.licfile location - Select the license file and click Open
- License Information Panel immediately shows "Licensed" status
-
No internet verification needed - file contains authorization
-
Deploy to Multiple Systems
- Copy the same
.licfile to all licensed computers (via USB, network share, etc.) - Install XPF on each system
- Repeat Step 3 (Load License File) on each installation
- All systems activate instantly with the same file
Alternative: Offline Key Activation
If you need to activate with a license key on air-gapped systems:
- Generate Activation Request
- On offline PC: Open License window
- Note your UID and Hardware ID (HWID) shown in License Information Panel
-
Provide these to support via email (from internet-connected PC)
-
Receive Offline License Key
- Support generates special offline key tied to your UID/HWID
-
Transfer key to offline system (USB drive, printed paper, etc.)
-
Enter Key on Offline System
- Click "Activate" button in License window
- Enter the offline license key
- System validates locally without internet
- Status changes to "Licensed"
Enterprise Support Benefits:
- Priority email support response (24-hour guarantee)
- Optional phone support available
- Custom Service Level Agreements (SLAs)
- Dedicated account management
- Volume discount pricing
- Flexible deployment options (offline, network, etc.)
- Purchase order and invoice billing accepted
Recommended for Industrial Environments
License files (.lic) are ideal for secure facilities, air-gapped networks, or environments where internet access is restricted for security reasons.
Contact Enterprise Sales View Volume License Options
Common installation and activation issues
Installation Problems
Application won't start or crashes immediately:
- Install latest .NET Framework from Microsoft
- Right-click XPF → "Run as Administrator"
- Check Windows Defender isn't blocking the application
- Verify system meets minimum requirements (Windows 10/11)
Serial ports not showing in interface:
- Install drivers for your USB-to-serial adapter
- Check Device Manager for COM port assignments
- Some generic adapters need specific drivers (FTDI, Prolific, etc.)
- Try different USB ports if adapter not recognized
Network connection problems:
- Windows Firewall may block Modbus TCP (port 502)
- Add firewall exception: Control Panel → Windows Defender Firewall → Allow an app
- Corporate networks sometimes block non-standard ports
- Verify IP address and subnet configuration
Activation Issues
"Invalid Key" error when activating:
- Verify you copied the complete license key (including all dashes)
- Check for extra spaces at beginning or end of key
- Ensure key matches the UID shown in License window
- Contact support if key was purchased for different UID
"Connection Error" during activation:
- Check internet connection is active
- Verify firewall isn't blocking XPF's internet access
- Try temporarily disabling antivirus software
- Some corporate proxies block activation - contact IT
Microsoft Store activation not working:
- Ensure you're signed in with correct Microsoft Account
- Check Microsoft Store app is updated to latest version
- Try signing out and back in to Microsoft Account
- Restart XPF after completing purchase
License shows "Expired" unexpectedly:
- Verify system clock is set correctly (wrong date can cause this)
- Check if subscription renewal payment failed
- Contact support to verify license status
Performance Issues
Slow startup or sluggish performance:
- Close unnecessary applications consuming RAM
- Check for Windows updates pending installation
- Disable communication logging when not needed
- Reduce number of monitor points being polled
High memory usage:
- Disable Event Log if not needed (major memory consumer)
- Limit chart buffer size (set Samples value instead of unlimited)
- Clear log files periodically
- Reduce poll rate for large register lists
Still Having Issues?
Email Support: support@quantumbitsolutions.com
Community Forum: quantumbitsolutions.com/forums
Knowledge Base: Technical Resources
License Comparison:
| Feature | Trial | Standard | Enterprise |
|---|---|---|---|
| Duration | Time-limited | Perpetual | Perpetual |
| Full Features | Yes | Yes | Yes |
| Updates | During trial | 1 year included | Custom terms |
| Installations | 1 PC | 1 PC per license | Multiple PCs |
| Support | Community forum | Email support | Priority support |
| Offline Use | Yes | Yes | Yes (special activation) |
| Price | Free | View pricing | Contact sales |
3. GUI - Understanding the App Interface
Application Window
The main application window of Modbus Monitor XPF is organized into several key sections that work together to provide a comprehensive Modbus communication interface.
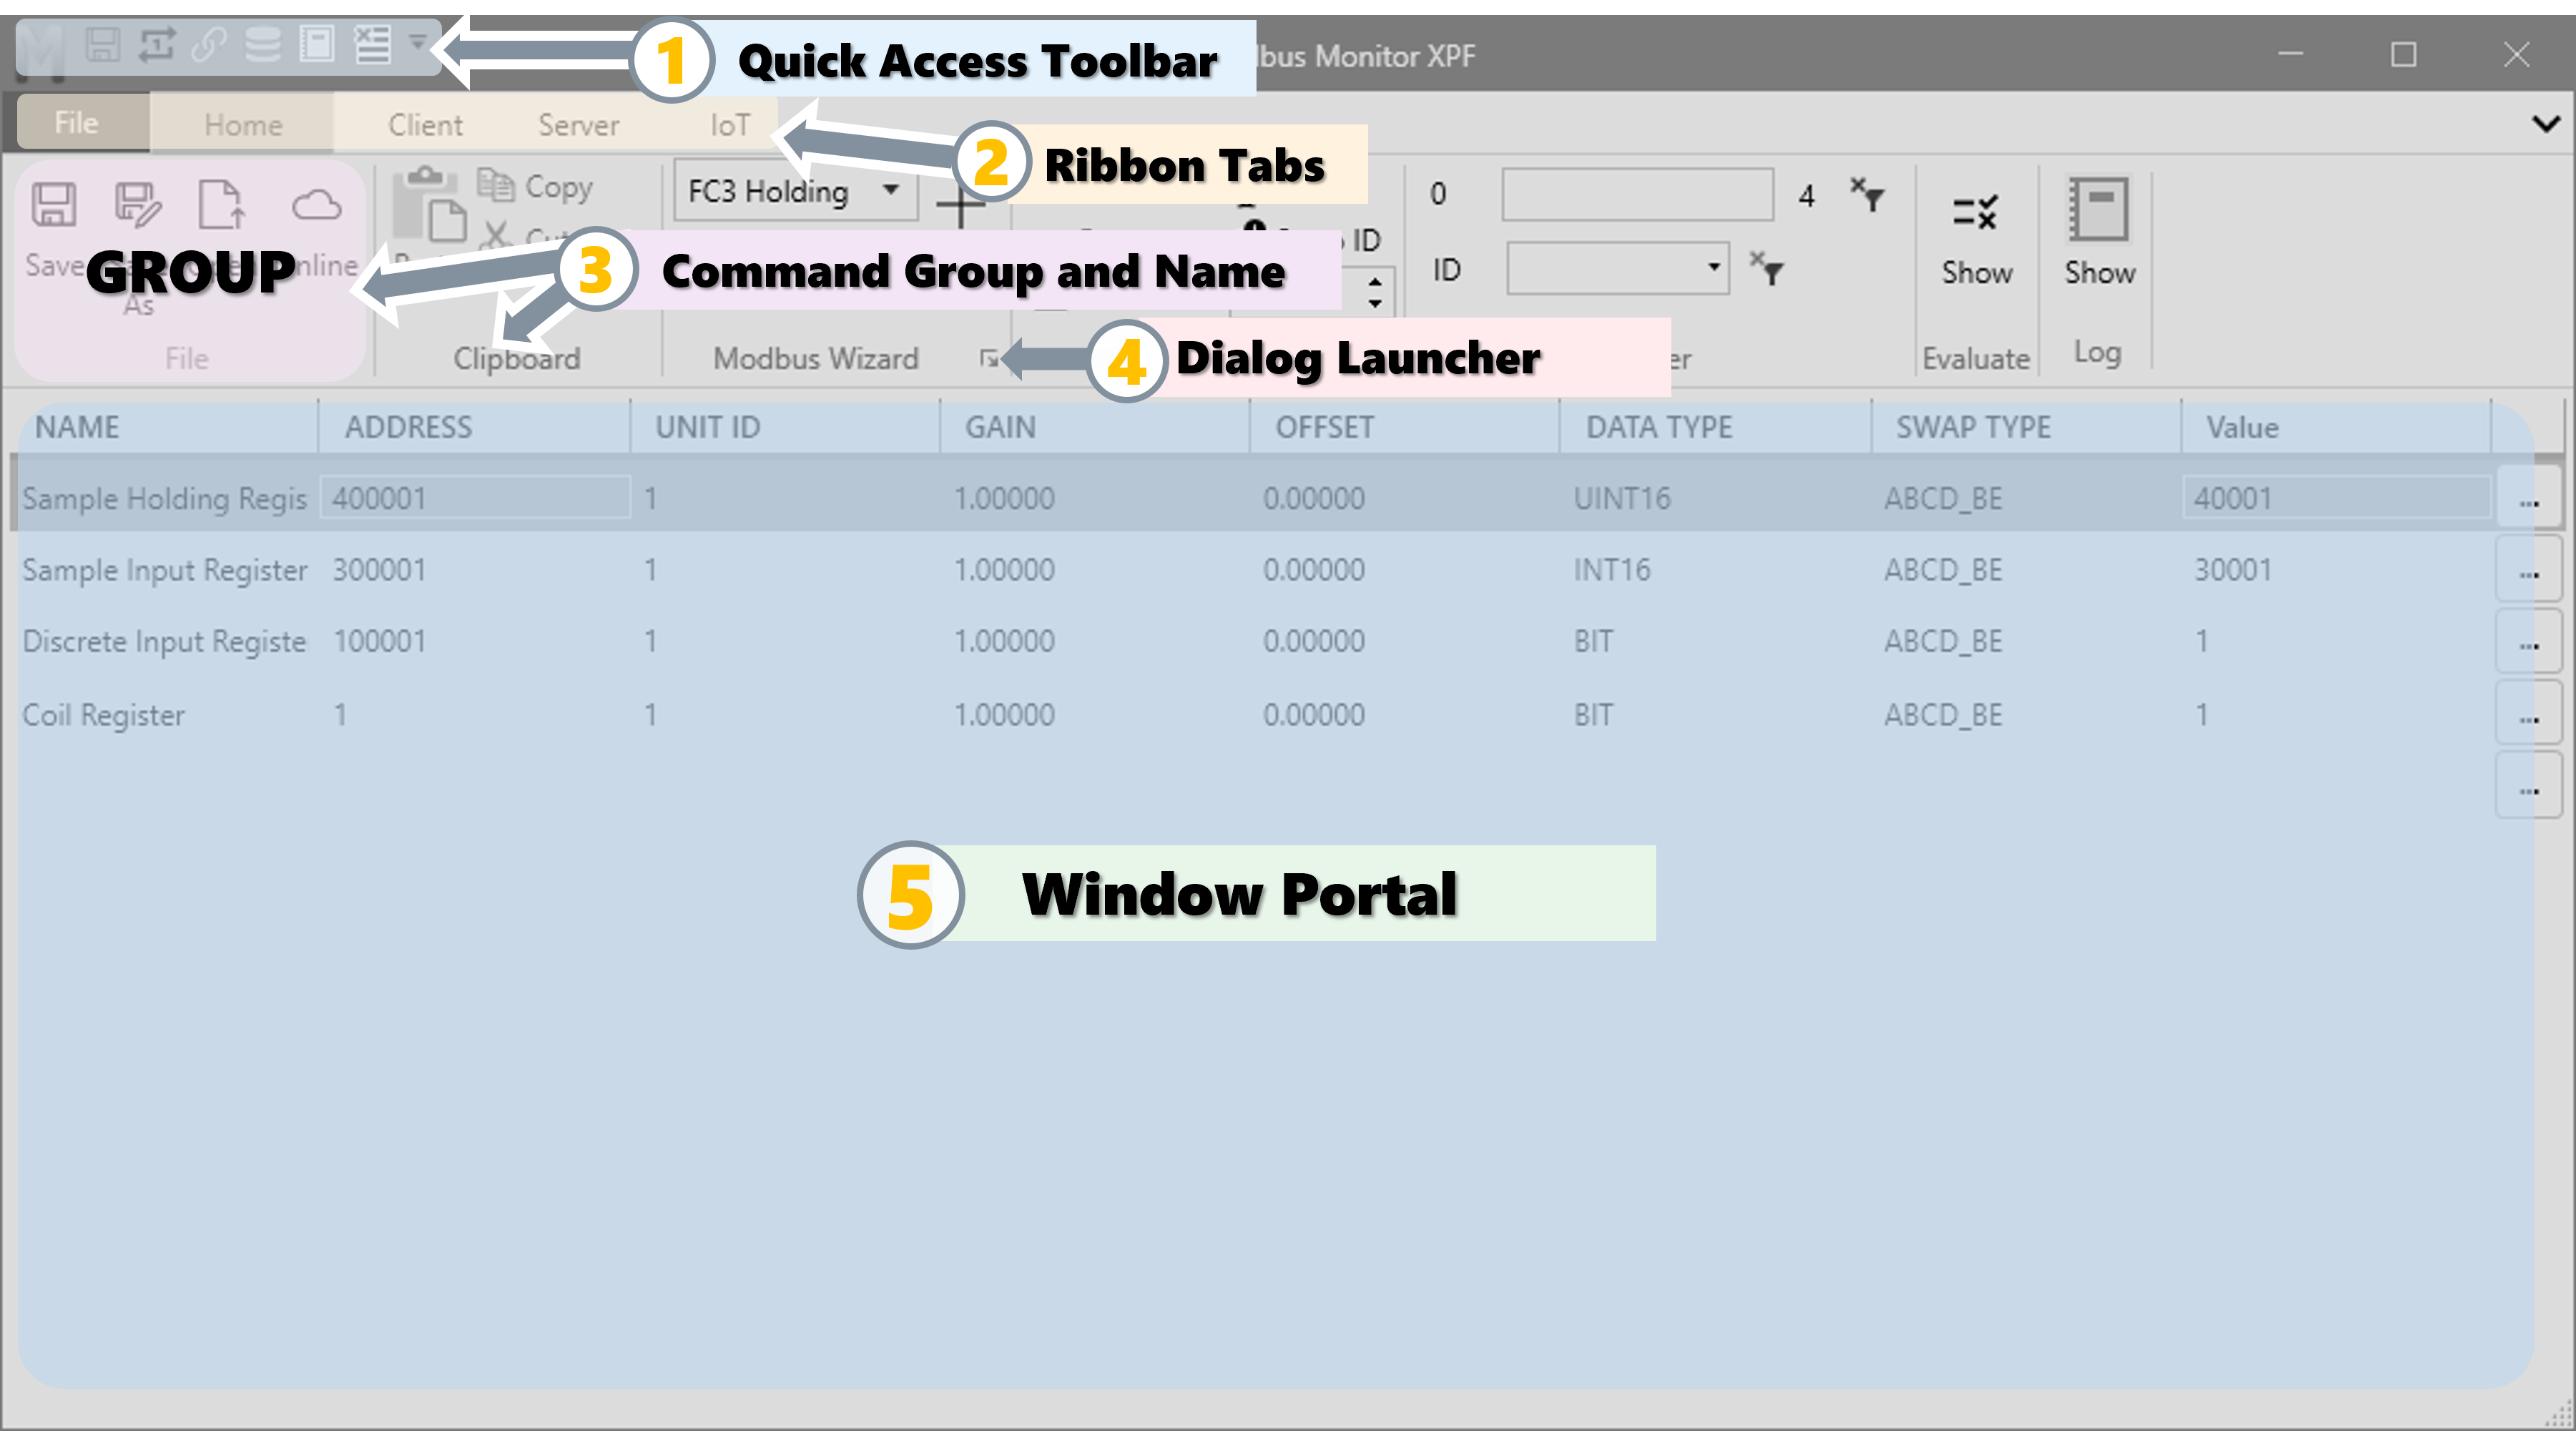 Figure 3.1: Main application interface showing five key areas (1, 2, 3, 4, 5)
Interface Component Structure:
graph TB
    QAT["1 Quick Access Toolbar<br/>Customizable one-click commands<br/>Save • Open • Read • Start • Show"]
    TABS["2 Ribbon Tabs<br/>File • Home • Client • Server • IoT"]
    GROUPS["3 Command Groups<br/>Clipboard • Modbus Wizard • List<br/>Filter • Evaluate • Log"]
    LAUNCHER["4 Dialog Launcher<br/>Small arrows in group corners<br/>Access extended options"]
    PORTAL["5 Window Portal Area<br/>Monitor Points • Log • Chart • Online Maps"]

    QAT -.-> TABS
    TABS -.-> GROUPS
    GROUPS -.-> LAUNCHER
    GROUPS -.-> PORTAL

    style QAT fill:#e3f2fd,stroke:#1976d2,stroke-width:2px
    style TABS fill:#fff3e0,stroke:#f57c00,stroke-width:2px
    style GROUPS fill:#f3e5f5,stroke:#7b1fa2,stroke-width:2px
    style LAUNCHER fill:#ffebee,stroke:#c62828,stroke-width:2px
    style PORTAL fill:#e8f5e9,stroke:#388e3c,stroke-width:2px
The application window contains five main areas:
Cross-Reference with Screenshot and Diagram
Each numbered section (1, 2, 3, 4, 5) in the annotated screenshot and the diagram above corresponds to the detailed descriptions below. Use these visual guides to quickly locate features in the actual application.
1. Quick Access Toolbar
Located at the very top, this toolbar provides one-click access to frequently used commands. You can customize which buttons appear by right-clicking the toolbar.
Available Quick Access Toolbar Buttons:
| Button | Function | Description |
|---|---|---|
| Save | Save configuration | Quickly save your current Modbus map configuration to CSV file |
| Open | Open file | Load previously saved configuration |
| Chart | Open chart view | Switch to Chart visualization window |
| Read | Read once | Poll all monitoring points once and stop |
| Write | Write once | Write selected monitor point value once |
| Client | Modbus Client | Start/Stop continuous polling of all monitoring points |
| Server | Modbus Server | Start/Stop Modbus Server |
| Show | Show log | Toggle Event Log / Communication Log view |
| Start | Log Controls | Start/Stop Communication events captures |
| Clear | Clear logs | Clear all entries from Communication Log window |
Customization Options:
- Show Below the Ribbon: Position toolbar below ribbon tabs instead of above
- Checkmarks: Indicate which buttons are currently visible on toolbar
- Right-click: Access customization menu any time
- Add/Remove: Click any button name to toggle its visibility
Recommended Quick Access Setup
For daily operations, most technicians keep these buttons visible:
- Save - Quick configuration saves during field work
- Read - Single poll to check current values
- Start/Stop - Control polling quickly
- Show - Toggle between Monitor Points and Log views
- Clear - Clear logs between test runs
This provides instant access to 90% of common operations without navigating through ribbon tabs.
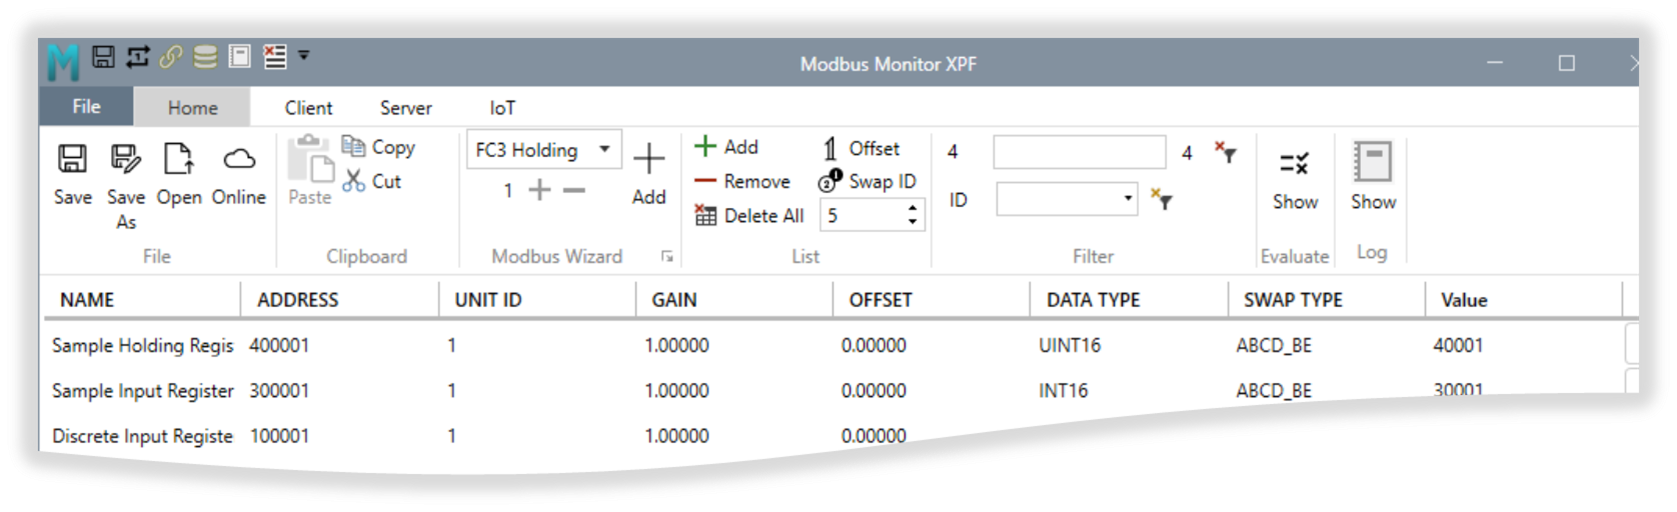
2. Ribbon Tabs Overview
Below the Quick Access Toolbar, you'll find multiple tabs that organize all application features. The standard Modbus Monitor XPF ribbon contains the following tabs, from left to right:
Standard Tabs (Always Visible):
| Tab | Purpose | Key Features |
|---|---|---|
| File | Backstage view | File operations, licensing, theme settings, recent files, online resources, exit |
| Home | Main Operations | Copy/paste, Modbus Wizard, list management, filtering, evaluation |
| Client | Modbus Client (Master) | Interface selection, timeouts, write functions, scanner, charts, poll controls |
| Server | Modbus Server (Slave) | Interface config, Modbus TCP Server, Modbus RTU Server, traffic capture, simulation |
| IoT | Cloud integration | ThingSpeak logging, MQTT messaging, cloud-to-device communication |
| HMI | HMI dashboard design | Widget-based operator dashboard authoring and runtime view. See HMI Guide and 6A. HMI Tab and Widgets (v5.0.0.0+) |
Contextual Tabs (Appear Dynamically):
| Tab | Trigger | Key Features |
|---|---|---|
| Log Options | Event Log active | Filter errors, export logs, auto-scroll, timestamp format, clear history |
How Contextual Tabs Work
Contextual tabs (also known as Option Tabs) appear only when you activate specific features, providing relevant controls without cluttering the interface.
Examples: - Click Show button in Home tab → Log group → Log Options tab appears
When you deactivate the feature (close log, close chart), the contextual tab automatically disappears.
The active tab is highlighted, making it easy to see which commands are currently available.
3. Command Groups (Ribbon Commands)
In the middle section of each ribbon tab, you'll find groups of related command buttons:
- Add Device - Add new monitor points to your list
- Delete Device - Remove selected monitor points
- Offset ID - Change address base or Unit ID for all points
- And many more, organized by function
Buttons are accompanied by icons and arrows indicating their functions and options.
4. Dialog Launcher
Small buttons in the corner of command groups that open additional settings or options:
| Feature | Location | Purpose |
|---|---|---|
| Arrow Icon | Bottom-right of command groups | Opens extended dialogs |
| Advanced Options | Context-specific dialogs | Access detailed settings |
| Extended Settings | Beyond ribbon display | Configure advanced parameters |
5. Window Portal Area
The main workspace at the bottom displays different information depending on the selected mode:
| View | Trigger | Display Content |
|---|---|---|
| Monitor Points List | Default view | Table showing all Modbus monitoring points with Name, Address, Unit ID, Value, and register details |
| Log Window | Log button toggled | Communication events and Modbus traffic history |
| Chart Window | Chart button active | Time-series data visualization and trend analysis |
| Online Maps Navigator | Online button toggled | Browse and download pre-built Modbus maps from factory/community |
Each view provides relevant information for the specific task being performed.
Complete Ribbon Tab Reference
This section provides comprehensive coverage of all ribbon tabs and their functionality. Each tab contains groups of related commands organized by function.
File Tab
The File Tab provides access to the backstage view containing essential file operations, application settings, license management, and resources. Click the File tab to enter this full-screen view.
Home Section
The Home section provides quick access to your file system and document management:
| Feature | Icon/Button | Description |
|---|---|---|
| Home | Home button | Navigate to Documents folder |
| Open | Folder icon | Open folder in Windows Explorer |
| Up | Up arrow | Move up one level in directory tree |
| Current Folder | <Documents> |
Displays current folder name |
Recent Section
Quick access to recently used Modbus maps and configurations:
| Button | Function | Description |
|---|---|---|
| Refresh | Update list | Refresh the recent files list |
| Open Folder | Show location | Opens folder containing selected file |
| Open File | Load map | Loads selected configuration in XPF |
| Remove | Delete entry | Remove selected file from recent list |
| Delete | Clear all | Deletes all entries from recent list |
Quick File Access
The Recent Files list is the fastest way to switch between different device configurations. Your most commonly used maps are always one click away.
About Section
Access version information, documentation, and support resources:
| Option | Description | Action |
|---|---|---|
| Version | Current application version | Displays installed version number |
| Activate | License activation | Opens license window for activation |
| Submit Feedback | User feedback | Direct feedback to developers |
| Documentation | Online help | Access comprehensive online help |
| Videos | Tutorial videos | Links to YouTube tutorials |
| Contact Email | Support contact | Email address for inquiries |
| Privacy Policy | Data handling | View privacy policy details |
| EULA | License agreement | End User License Agreement terms |
Quick Actions:
- Need help? Click Documentation for online guides
- New to XPF? Click Videos for visual tutorials
- License issues? Click Activate to manage licenses
- Feature requests? Use Submit Feedback
Settings Section
Customize the application theme to match your environment:
| Theme | Description | Best For |
|---|---|---|
| Light | Bright interface | Well-lit environments, daytime use |
| Dark | Dark interface | Low-light environments, reduced eye strain |
| System Default | Follows Windows | Automatically matches Windows theme |
| Reset | Factory Reset | Restore all application settings to default values |
Theme Selection:
- Click File Tab → Settings
- Choose theme from dropdown
- Theme applies immediately (no restart needed)
Field Work Preference
Many field technicians prefer Dark theme when working in dimly lit equipment rooms or cabinets.
Exit
Exit button safely closes the Modbus Monitor XPF application:
- Saves current window position and settings
- Prompts to save unsaved changes (if any)
- Terminates all active connections properly
- Releases serial ports and network resources
Home Tab
The Home Tab contains the most frequently used commands for essential operations - everything you need for working with Modbus maps and monitoring points.
File Group
Import and Export Documents - Manage Documents, Import and Export Modbus Maps in CSV format. Access pre-built Modbus Maps for common devices (VFDs, Energy Meters, PLCs) from factory-validated or community sources.
| Feature | Description | Details |
|---|---|---|
| Save | Save current document in CSV format | Preserves entire Modbus map configuration including monitor points, settings, and extended properties for reuse |
| Save As | Save As New document | Preserves entire Modbus map configuration including monitor points, settings, and extended properties for reuse |
| Open | Open previously saved file | Load saved XPF configuration files (CSV format) from any location |
| Online | Download Modbus Maps from online folder or community | Access pre-configured maps from (1) factory-released validated maps or (2) community-uploaded maps. See Online Maps Feature below and Modbus Device Maps Start Page for searchable model previews. |
CSV Format Benefits
XPF saves configurations as standard CSV files, making them easy to:
- Edit in Excel or text editors for batch modifications
- Version control using Git or other systems
- Share with team members or across sites
- Document device configurations for compliance
Online Maps Feature:
Cloud-Based Modbus Maps - View and Download Online Modbus Maps from either (1) factory-released maps by Modbus Monitor or (2) community-uploaded maps from users. Toggle the Online button (shown in table above) to activate this feature. An internet connection is required to use this feature. For quick device discovery and compatibility checks, use the Modbus Device Maps Start Page before downloading/importing maps.
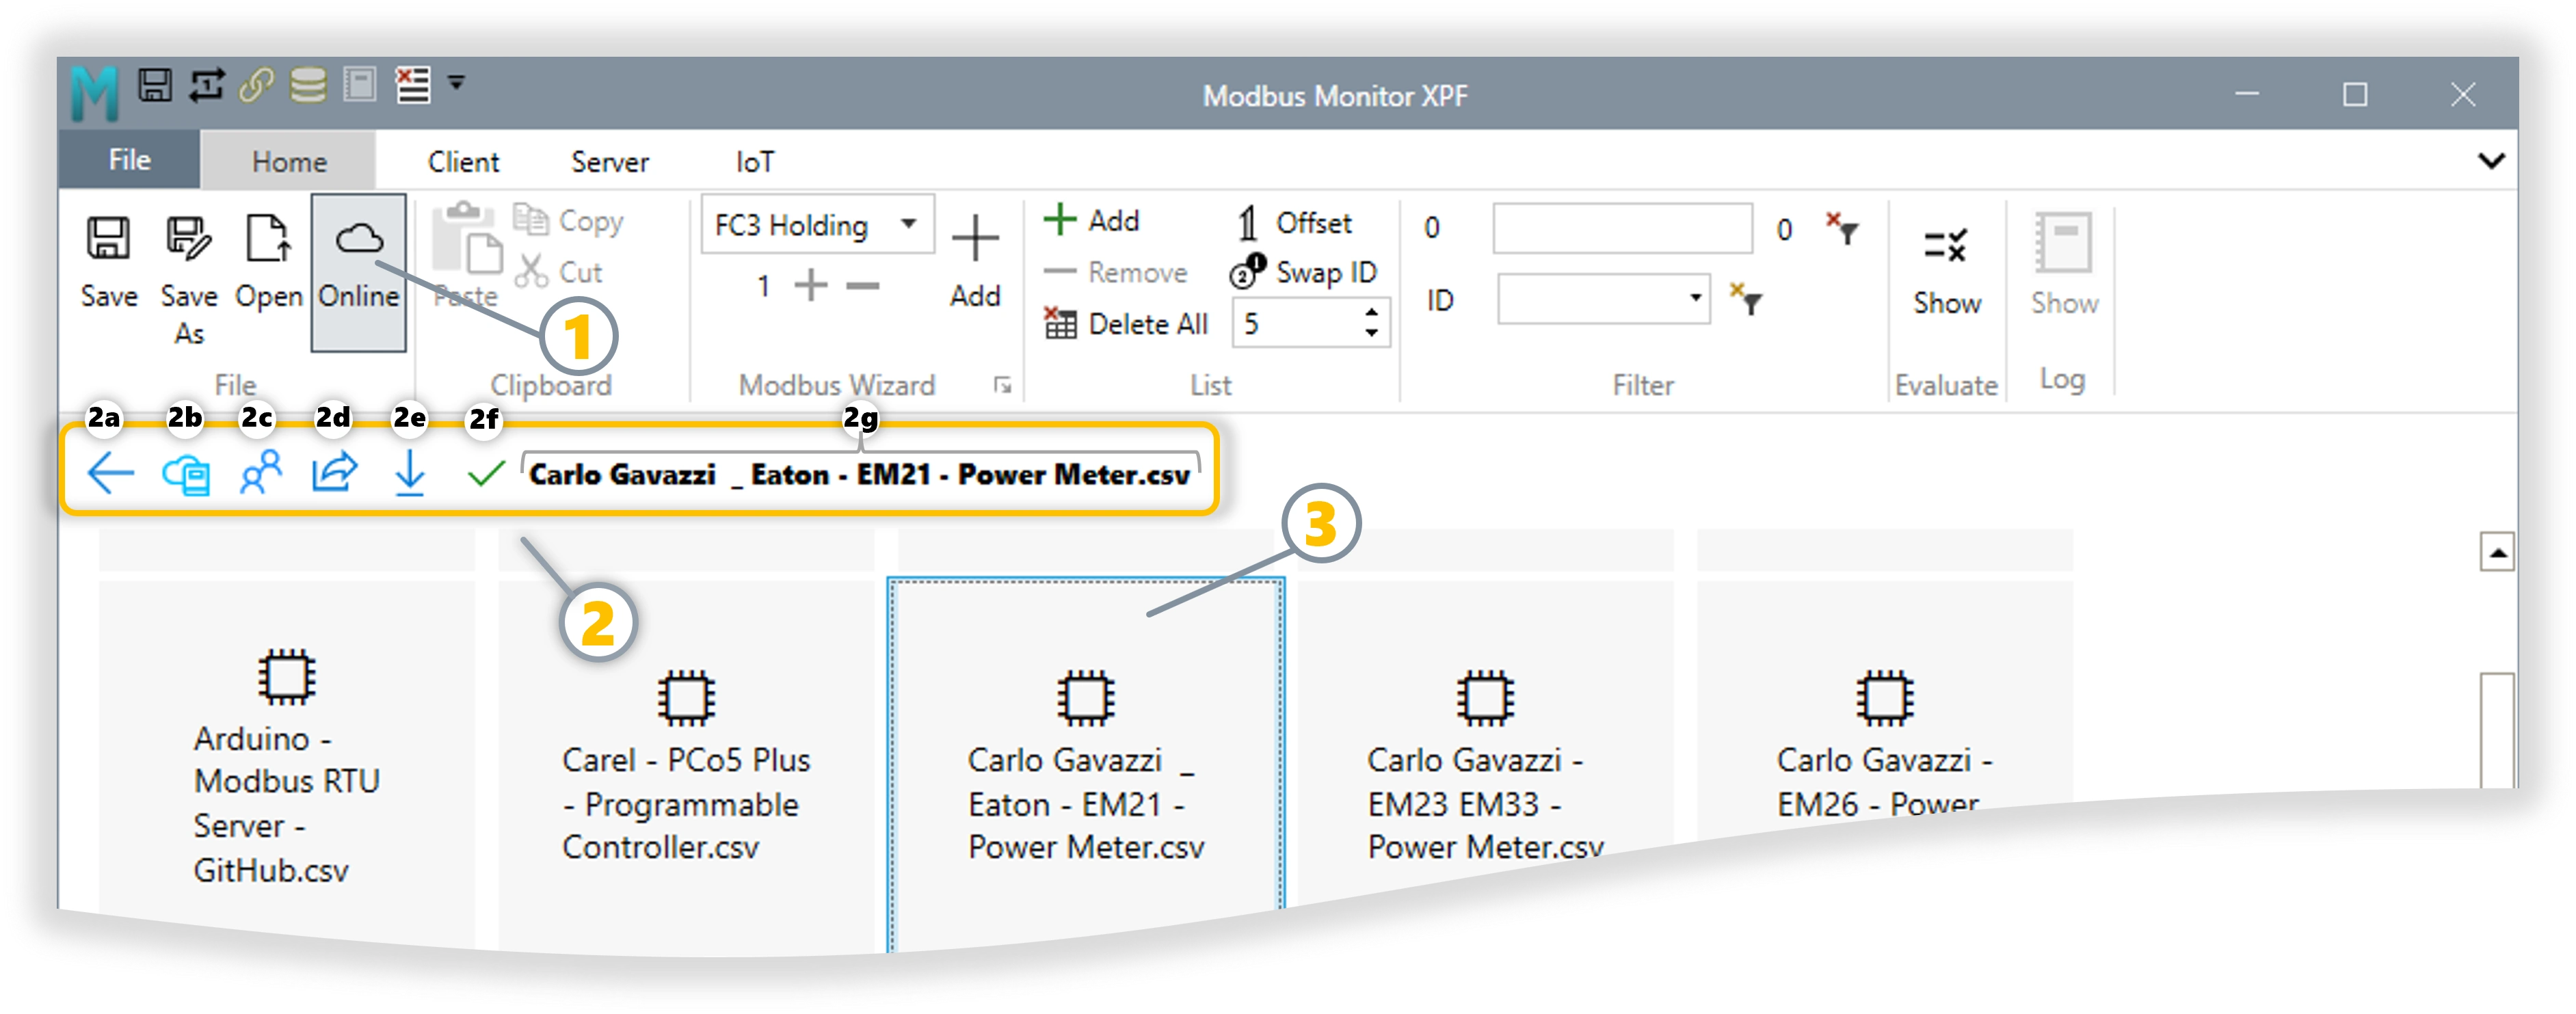 How to download pre-defined Modbus Map
Clipboard Group
Copy and Paste Operations - Transfer data between XPF and external applications like Excel. Copy, paste, and cut monitor points for quick duplication or reorganization.
| Operation | Shortcut | Description |
|---|---|---|
| Paste | Ctrl+V |
Paste from clipboard from selected row(s) - either from the application or Microsoft Excel. Adds to end of list. |
| Copy | Ctrl+C |
Copy selected single or multiple row(s) to clipboard. Multiple sequential rows can be selected with Shift+Click's first and last row. Multiple rows in any order using Control+Click. |
| Cut | Ctrl+X |
Copy the content of the current item to clipboard and delete the item from the list. |
Modbus Wizard Group
The Modbus Wizard provides a streamlined interface for configuring monitor points without manually editing the table. Access it by clicking the Dialog Launcher (small arrow) in the Modbus Wizard group corner.
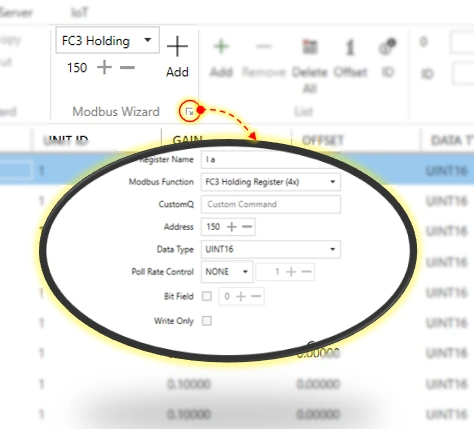 Modbus Wizard configuration interface
Configuration Fields:
| Field | Purpose | Options/Format |
|---|---|---|
| Register Name | Descriptive identifier | Text field - name your monitor point |
| Modbus Function | Register type and access | See Address Field - 6-Digit Format in Monitor Points Configuration |
| Sub-Function | Function variant (FC8 only) | Appears for FC8 Diagnostics - e.g., "0 (0x0) Return Query Data" |
| Device ID | Device identification type (FC43-14 only) | Appears for FC43-14 - e.g., "01 Get Basic Device ID (stream)" |
| Object ID | MEI object identifier (FC43-14 only) | Appears for FC43-14 - Object number (00-FF hexadecimal) |
| CustomQ | Custom Modbus Packet | Add PDU part of the Modbus Command to send any command |
| Data Request | Request address/value | Address or data value for the request |
| Address | Modbus Address | Zero or One based Modbus Address (see 6-digit format) |
| Data Type | Data interpretation | See Data Type Options in Monitor Points Configuration |
| Poll Rate Control | Update frequency | NONE, SKIP, ONCE, INTERVAL (Adjust Poll Rate value) |
| Bit Field | Extract specific bit | 0-15 for 16-bit registers - selects individual bit |
| Write Only | Skip during reads | Checkbox - for write-only registers |
Function-Specific Fields
The wizard dynamically displays additional fields based on the selected Modbus Function:
- FC8 Diagnostics: Shows
Sub-Functiondropdown with diagnostic test options - FC43-14 Read Device Identification: Shows
Device IDandObject IDfields for MEI object selection - These fields only appear when their corresponding function is selected
List Group
Add and Remove Points - Add, remove, or modify monitor points in bulk. Change addressing modes (0-based/1-based), swap Unit IDs globally, or set decimal precision for all numeric displays.
The List Group provides essential tools for managing your Monitor Points (also called Rows or Items) in the configuration table:
| Button | Function | Description |
|---|---|---|
| Add | Add new point | Creates new row with default values. Automatically increments address by one from the last row for quick sequential entry. |
| Remove | Delete selected point(s) | Removes selected monitor point(s) from the table. Select multiple with Ctrl+Click (non-sequential) or Shift+Click (range). |
| Delete All | Clear entire list | Removes ALL monitor points from the table. Use with caution - this action cannot be undone! |
| Offset | Toggle address base | Switch between 1-based (1-65536) and 0-based (0-65535) addressing for all addresses in the list. |
| Swap ID | Change Unit ID globally | Updates Unit ID (Slave/Station ID) for all monitor points at once. Useful when reconfiguring for a different device. |
| Decimal Places | Set display precision | Configure the number of decimal places for displaying numeric values throughout the application. |
Filter Group
Search and Filter Monitor Points - Search Name and Address fields to quickly locate specific monitor points. Filter large lists by text search or Unit ID to focus on relevant registers during troubleshooting or configuration.
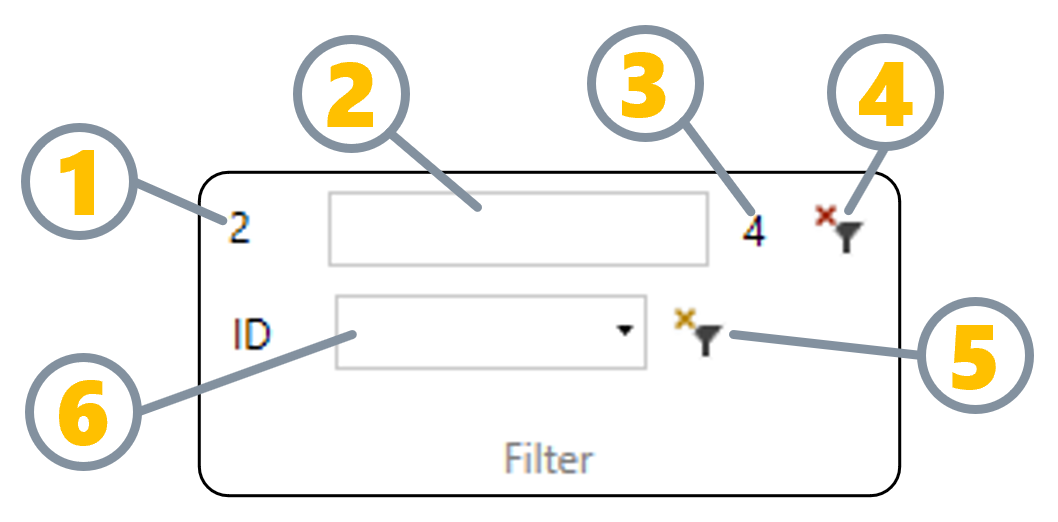
Filter Components:
| Label | Component | Description |
|---|---|---|
| 1 | Row Index | Shows the index of the currently selected row. Especially useful when the list is filtered to know the true row number. -1 when none Selected. |
| 2 | Filter Text Box | Enter text to search. Filters all Name and Address fields that contain the entered text. |
| 3 | Total Rows | Shows the total number of rows in the current view (filtered or full list). |
| 4 | Clear Filter | Clears the text filter and shows all rows in the list. |
| 5 | Clear ID | Clears the ID filter and shows all rows in the list. |
| 6 | ID Dropdown | Select Unit ID (Slave ID or Station ID) to filter by device. Combine with text filter for precise results. |
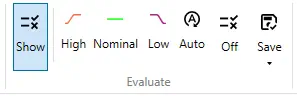
Evaluate Group
Value Validation and Testing - Validate register values against configurable limits with automatic color coding. Set pass/fail thresholds for quality control testing or equipment health monitoring.
Change the background colors of the Value cell based on the High, Low, and Nominal Limits. Quickly validate the value from the Modbus device and test to see if it is within the valid range.
See Evaluate Group Details for comprehensive configuration options, workflows, and color-coding reference.
Log Group
Communication Monitoring and Logging - View and record all Modbus communication traffic for troubleshooting. Filter errors, export logs to file, and timestamp all events for accurate diagnostics.
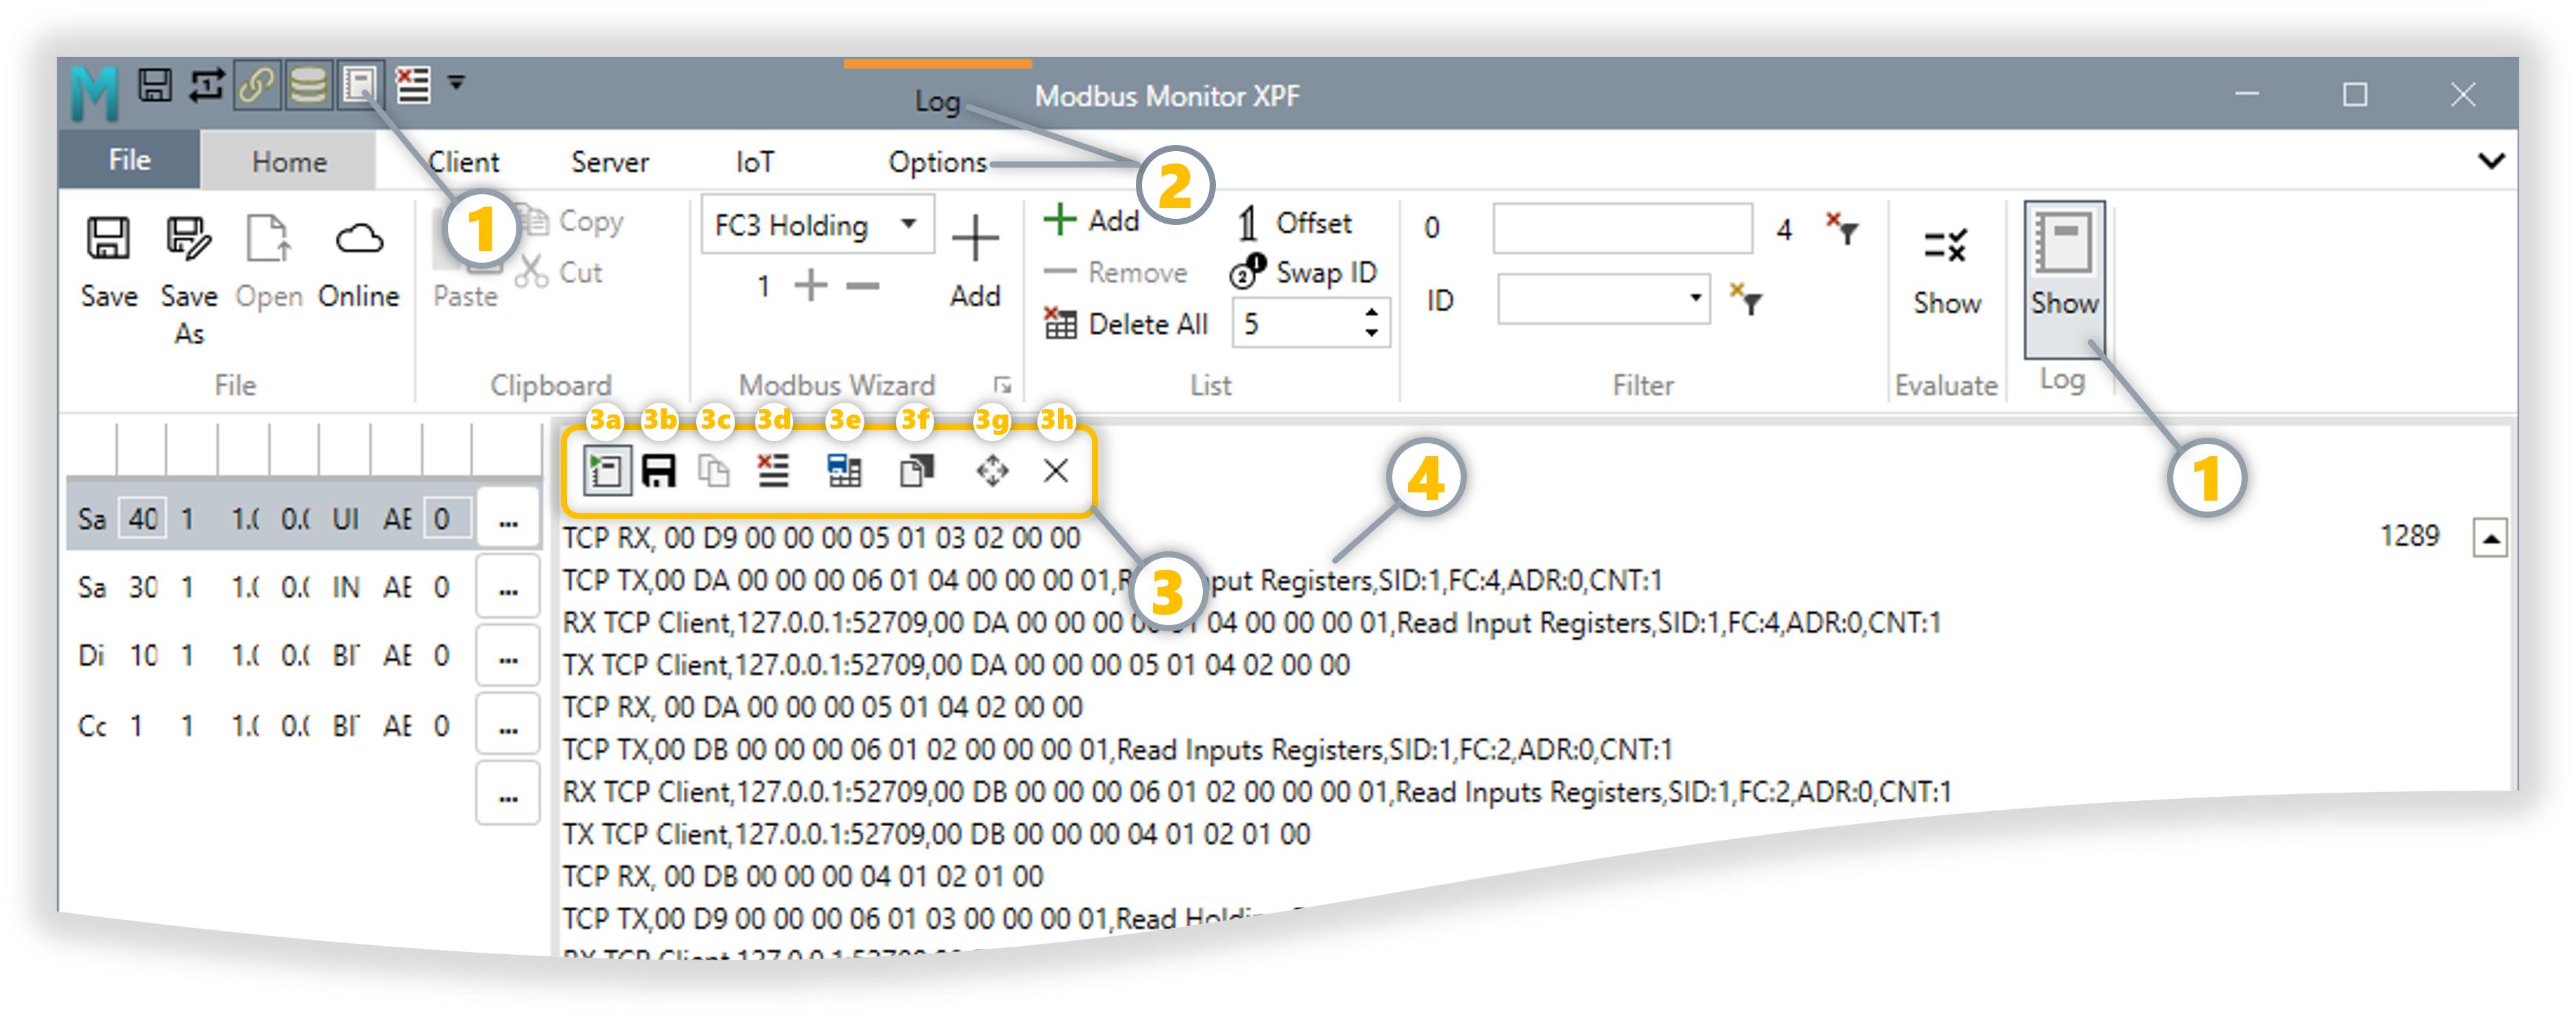 Four key areas: 1 Log Group (Home Tab), 2 Options Tab, 3 Quick Access Header (3a-3h), 4 Log Window
Complete Log Controls Reference:
All log controls in one comprehensive table. Labels 1, 2, 3a-3h, and 4 correspond to the screenshot above.
| Label | Control | Location | Type | Function |
|---|---|---|---|---|
| 1 | Show | Home Tab → Log Group | Toggle Button | Show/hide Event Log view. Pressed: Replaces Monitor Points table with log display, Options tab appears. Released: Returns to Monitor Points table. |
| 2 | Log/Options Tab | Contextual Ribbon | Dynamic Tab | Appears when log is active. Contains logging and filter controls. Disappears when log closed (logging continues in background if started). |
| 2 | Filter | Quick Access Header or Options Tab | Text Input Box | Real-time text search. Type to filter log entries, clear to show all. Case-insensitive search. |
| 2 | Errors | Options Tab | Toggle Button | Checked: Show errors only (timeouts, exceptions). Unchecked: Show all events (success + errors). |
| 3a or 2 | Start/Stop | Quick Access Header or Options Tab | Toggle Button | Start: Begin capturing events. Stop: Pause recording. Auto-resumes if saved while running. |
| 3b or 2 | Auto Save | Quick Access Header or Options Tab | Toggle Button | ON: Continuously writes log to Documents folder. OFF: Logs remain in memory only. |
| 3c or 2 | Copy All | Quick Access Header or Options Tab | Button | Export all visible log entries to clipboard (timestamp + details). Paste into Excel, email, or text editor. Click on any log entry to enable this button. |
| 3d or 2 | Clear | Quick Access Header or Options Tab | Button | Delete all log entries from display. Warning: Cannot be undone. Save or copy important logs first. |
| 3e | Save | Quick Access Header | Button | Save current log entries to a file in Documents folder. |
| 3f | Float | Quick Access Header | Button | Float the Log window outside the application's main window as a separate window. |
| 3g | Expand | Quick Access Header | Button | Expand log window to full screen or restore to normal size. |
| 3h or 2 | Close | Quick Access Header or Options Tab | Button | Close Log Window and return to Monitor Points (logging continues in background if started). |
| 4 | Log Window | Window Portal Area | Display Panel | Shows timestamped communication events. Replaces Monitor Points table when log is active. |
Client Tab
Client Mode Overview: XPF operates as a Modbus Master (Client) when you want to read data from or write data to remote Modbus devices. In this mode, XPF initiates all communication by sending requests to Modbus Server devices (PLCs, drives, meters, sensors) and processes their responses.
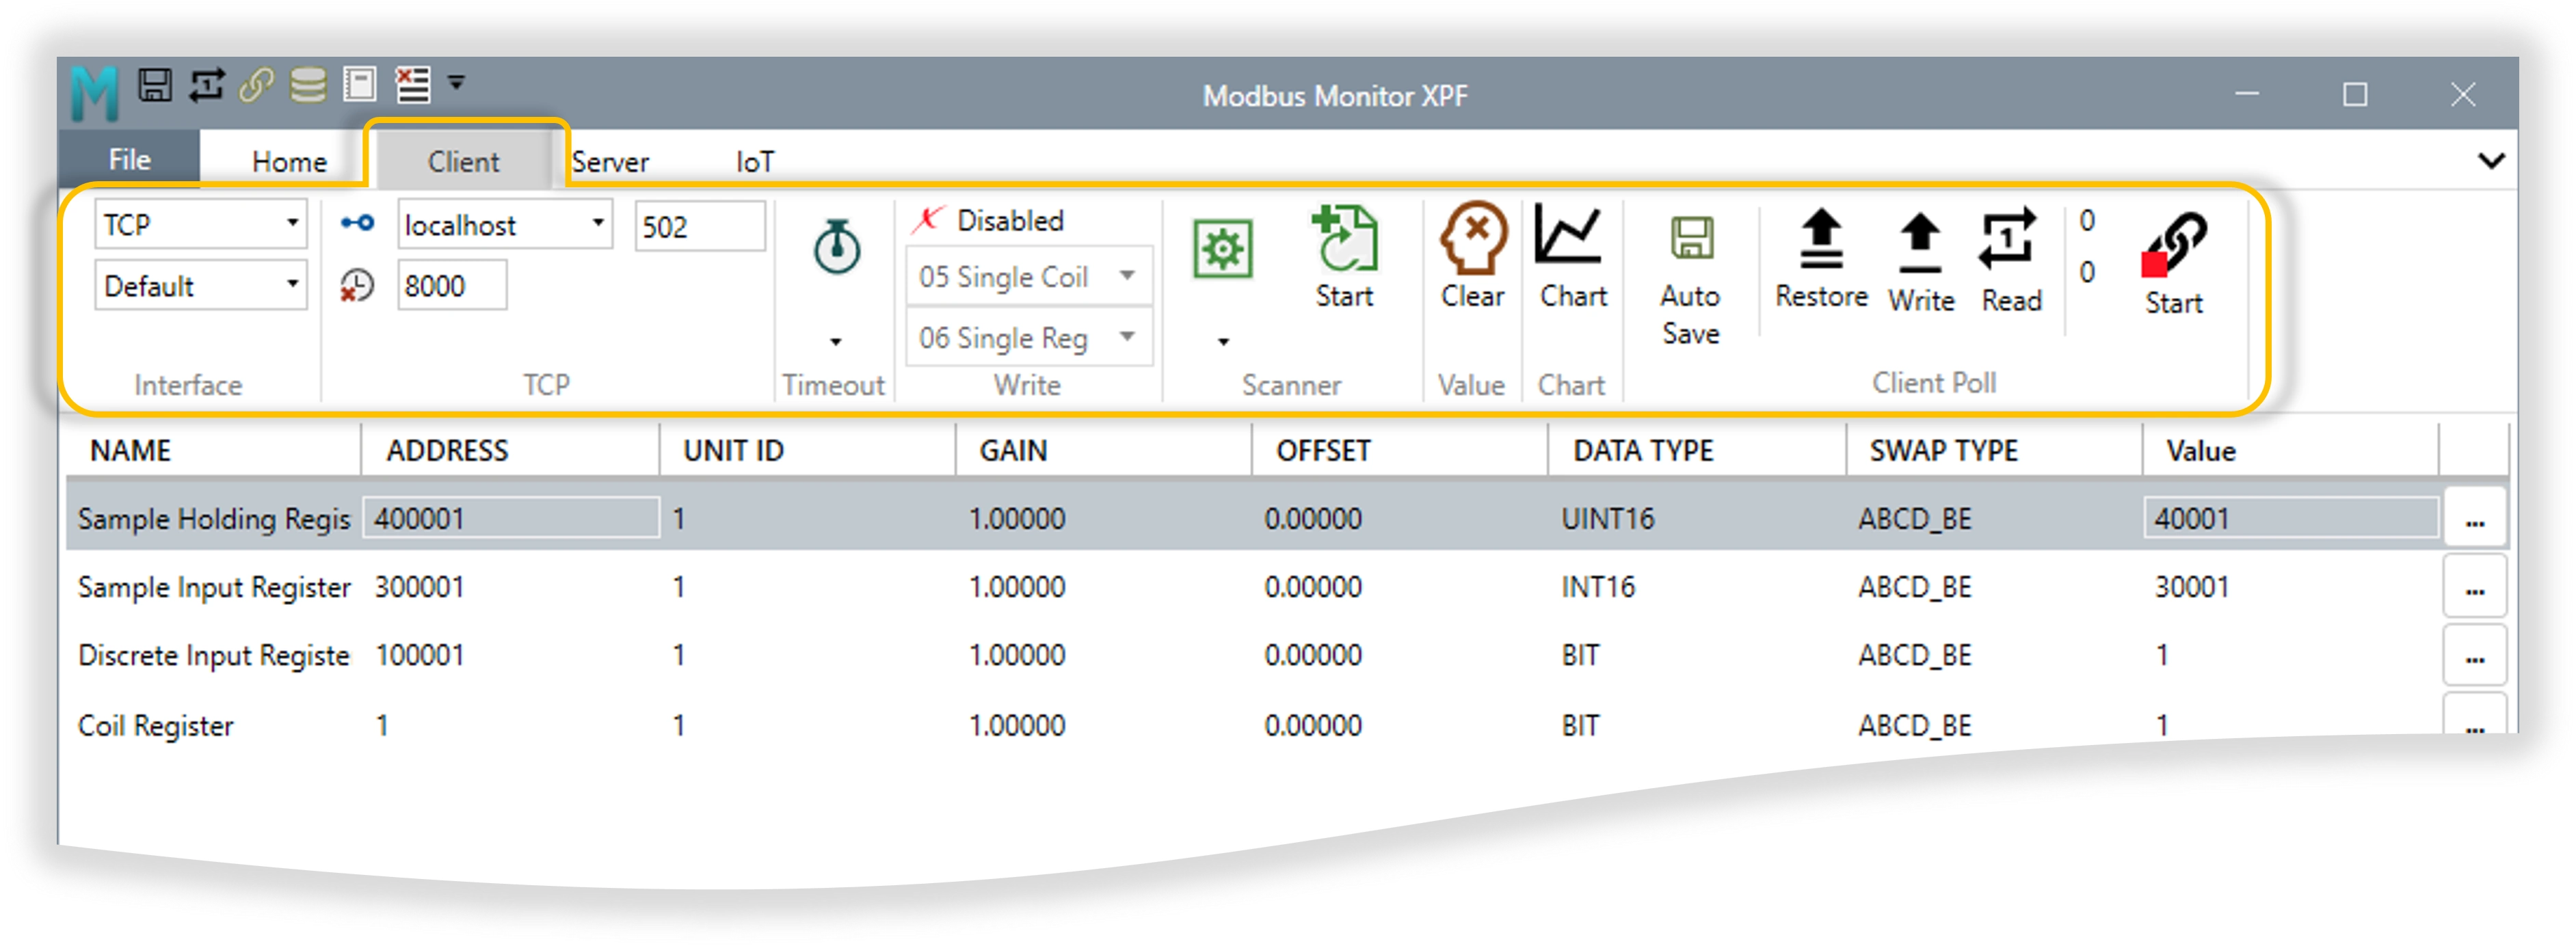
Client Tab Groups & Features
Complete reference for all Client tab ribbon groups and their functionality:
| Group | Purpose | Key Features | Description |
|---|---|---|---|
| Interface | Protocol Selection | Interface Type, Protocol Options, One-Based Toggle | Choose connection type (TCP/UDP/Serial) and Modbus protocol variant (Standard/RTU/ASCII) |
| TCP | Network Settings | IP Address, Port, Connection Timeout | Configure Ethernet-based connections with IP address, port number, and connection timeout settings |
| Timeout | Timing Control | Response Timeout, Inter-Frame Delay, Poll Rate, Retries | Critical timing parameters for reliable communication and performance optimization |
| Scanner | Address Discovery | Start Address, Register Count, Data Type, Swap Type, Unit ID | Systematically discover unknown registers and automatically build monitor point lists |
| Value | Data Management | Clear Values Toggle | Click: Immediately clears all values from display. Toggle ON: Automatically clears all monitor point values before starting each polling cycle for fresh data collection |
| Chart | Data Visualization | Chart Button | Switch to real-time charting view for trending analysis of tagged monitor points - see Charts - Data Trends Visualization |
| Client Poll | Operation Control | Auto Save, Restore, Write, Read, Statistics, Start/Stop | Main operational controls for polling, data collection, and client status monitoring |
Server Tab
Server Mode Overview: XPF operates as a Modbus Server (Slave) when you want to simulate Modbus devices or provide data to Modbus Client applications. In this mode, XPF responds to requests from Modbus Master devices (SCADA systems, HMIs, PLCs) by serving data from your configured monitor points.
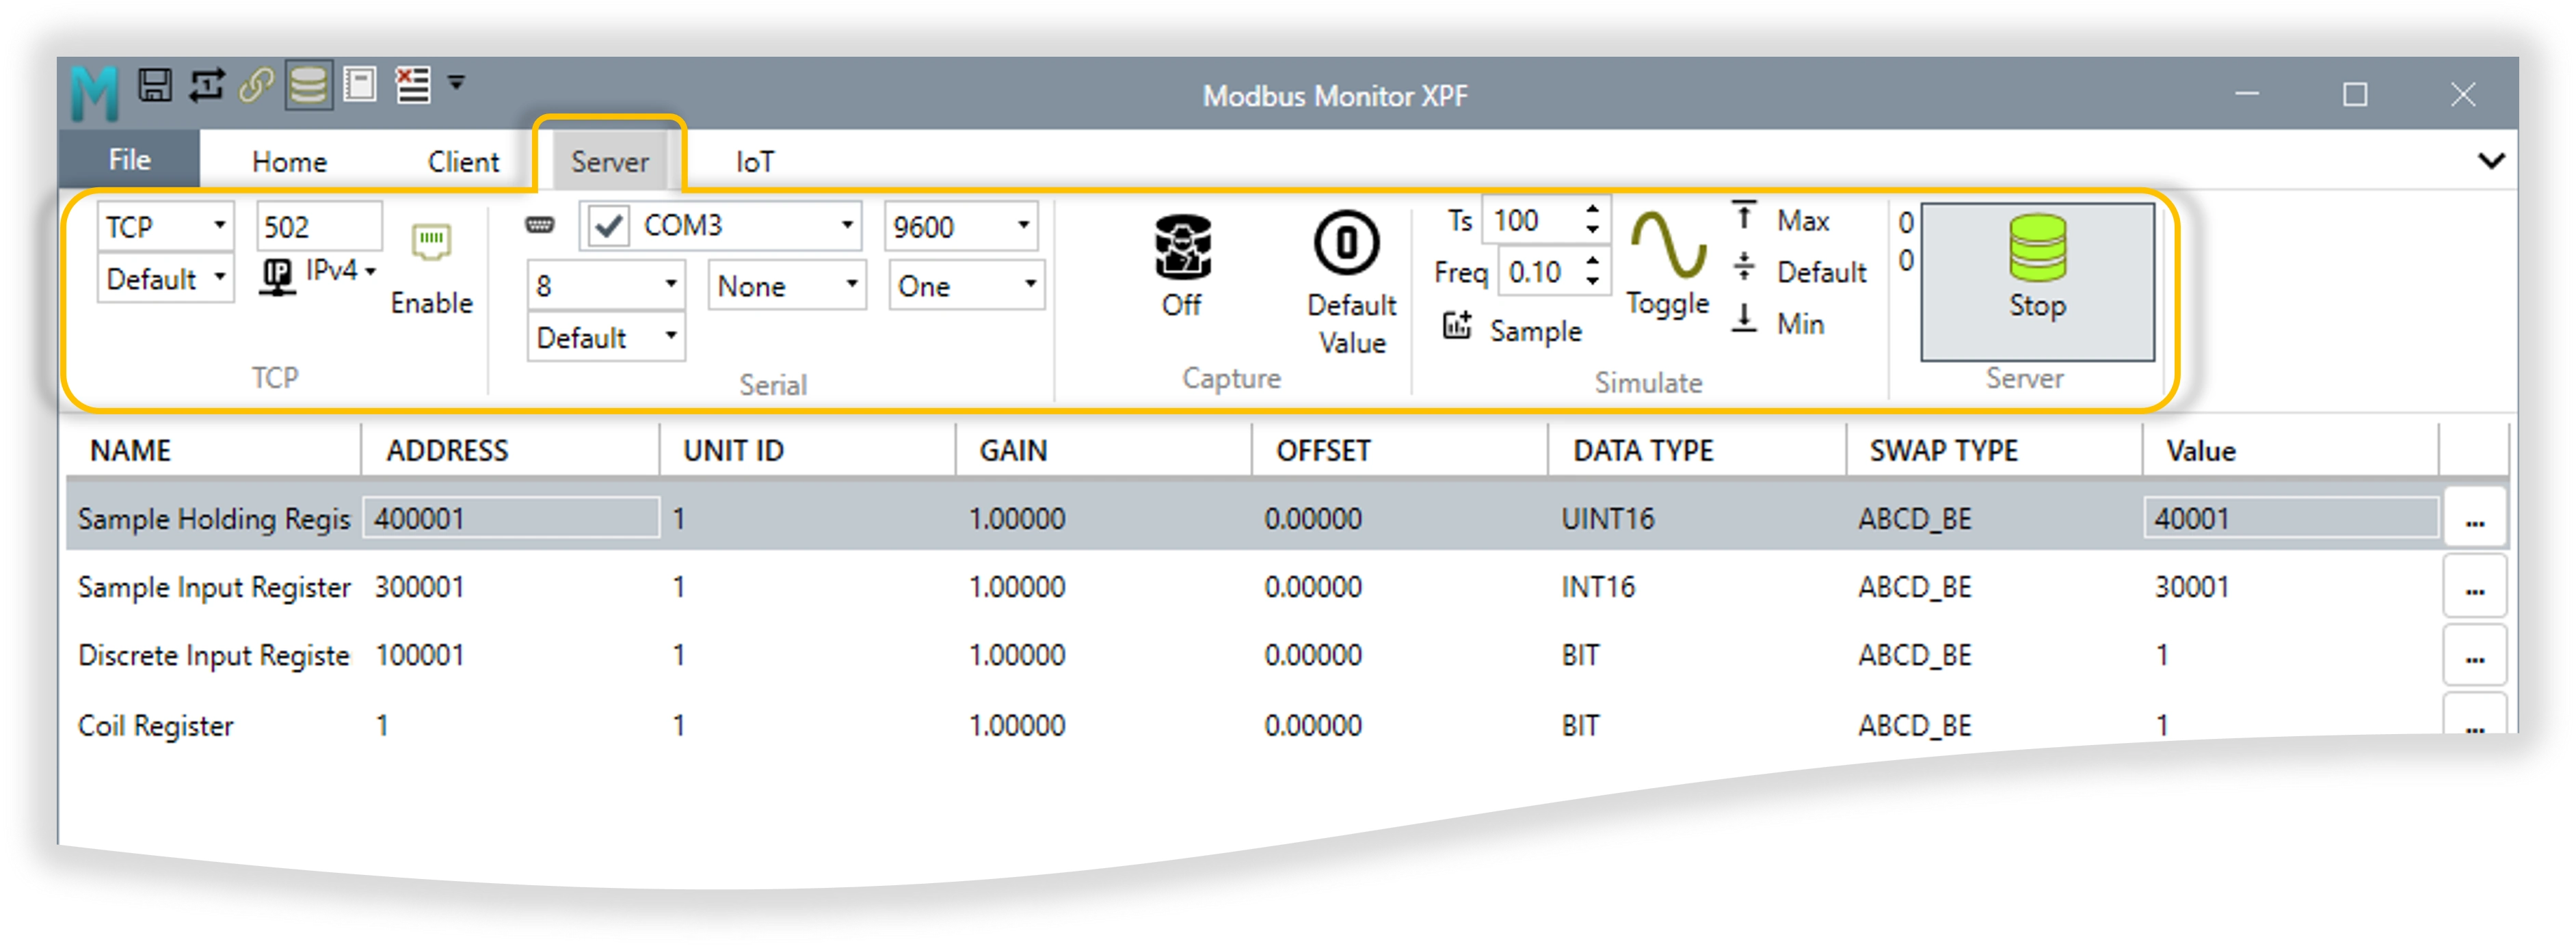
Server Tab Groups & Features
Complete reference for all Server tab ribbon groups and their functionality:
| Group | Purpose | Key Features | Description |
|---|---|---|---|
| TCP | Network Server | Interface Options: TCP, UDP Protocol Options: Default, RTU, ASCII Additional: Port, IP Configuration, Enable |
Configure TCP/UDP Modbus servers with protocol variants and network settings |
| Serial | COM Port Servers | COM Port Selection, Baud Rate, Data Bits, Parity, Stop Bits, Protocol | Configure serial Modbus servers on multiple COM ports with individual settings |
| Capture | Traffic Analysis | On/Off Toggle, Auto Value/Default Value | Automatically capture incoming requests and build Modbus maps from live traffic |
| Simulate | Data Generation | Sample Time, Frequency, Sample Generator, Value Controls | Advanced simulation engine for generating dynamic test data patterns |
| Server | Operation Control | Statistics, Connection Count, Start/Stop | Main server control with connection monitoring and operational status |
IoT Tab
IoT Tab Overview: The IoT tab provides cloud connectivity features for logging Modbus data to cloud platforms and enabling remote monitoring capabilities. It contains both core MQTT functionality and access to specialized add-ons.
IoT Tab Groups:
| Group | Type | Purpose | Details |
|---|---|---|---|
| MQTT | Requires License | Advanced MQTT messaging | Enhanced MQTT connectivity with enterprise features |
| ThingSpeak | Requires License | ThingSpeak integration | ThingSpeak cloud logging with automatic field mapping |
Licensed Features in IoT Tab:
Advanced MQTT connectivity with enhanced capabilities:
- Multi-broker support (simultaneous connections)
- Advanced security (TLS/SSL, client certificates)
- Complex topic mapping and dynamic generation
- Enterprise QoS management with persistence
- Pre-configured cloud templates (AWS IoT, Azure IoT, HiveMQ)
- Connection status monitoring and diagnostics
MQTT Data Reception:
- Subscribe to MQTT topics and update Monitor Points grid in real-time
- Works independently of Modbus Client/Server operations
- Supports external data integration from IoT devices, cloud services, and other systems
- Complete setup guide: MQTT Data Reception Guide
Use for: Enterprise IoT deployments, multi-broker environments, advanced security requirements
License Required: Purchase MQTT feature license to unlock full functionality
Setup Guide: 📖 Complete MQTT Feature Setup Guide
Specialized ThingSpeak cloud platform integration:
- Automatic field mapping (Row 1→field1, Row 2→field2, etc.)
- ThingSpeak-specific API optimization
- Channel management and configuration
- Professional visualization and analytics
- MATLAB integration capabilities
- Publish Group: Publishing controls and settings integrated with ThingSpeak
Use for: ThingSpeak cloud logging, automatic data visualization, professional dashboards
License Required: Purchase ThingSpeak feature license to unlock full functionality
Setup Guide: 📖 Complete ThingSpeak Feature Setup Guide
Choosing Your IoT Solution:
| Scenario | Recommended Feature | Reason |
|---|---|---|
| ThingSpeak cloud logging | ThingSpeak Feature | Automatic field mapping, optimized for ThingSpeak platform |
| Multiple MQTT brokers | MQTT Feature | Multi-broker support, flexible topic mapping |
| Enterprise IoT deployment | MQTT Feature | Advanced security, persistence, enterprise features |
| AWS IoT / Azure IoT | MQTT Feature | Pre-configured cloud templates |
| General MQTT messaging | MQTT Feature | Professional MQTT connectivity with advanced features |
| Cloud analytics and visualization | ThingSpeak Feature | Professional dashboards and MATLAB integration |
Quick Navigation:
- MQTT Feature Setup: MQTT Feature Guide - Multi-broker connectivity and enterprise features
- ThingSpeak Feature Setup: ThingSpeak Feature Guide - Cloud logging and visualization
- IoT Tab Configuration: Use IoT Tab → MQTT/ThingSpeak Groups in ribbon for licensed feature access
- Feature Licensing: Purchase feature licenses to unlock IoT Tab functionality
Key Concepts
graph TB
    MAP["MODBUS MAP / LIST<br/><i>Complete collection of all Monitor Points</i>"]

    subgraph TABLE["Monitor Points Table"]
        direction TB
        HEADER["<b>NAME | ADDRESS | UNIT ID | GAIN | OFFSET | DATA TYPE | SWAP TYPE | VALUE</b>"]
        ROW1["Motor Speed | 400001 | 1 | 1.00000 | 0.00000 | UINT16 | ABCD_BE | 1450"]
        ROW2["Line Voltage | 400002 | 1 | 1.00000 | 0.00000 | INT16 | ABCD_BE | 230"]
        ROW3["Pump Status | 100001 | 1 | 1.00000 | 0.00000 | BIT | ABCD_BE | 1"]
        ROW4["Temperature SP | 000001 | 1 | 1.00000 | 0.00000 | BIT | ABCD_BE | 1"]

        HEADER -.-> ROW1
        HEADER -.-> ROW2
        HEADER -.-> ROW3
        HEADER -.-> ROW4
    end

    ENGINE["XPF POLLING ENGINE<br/><i>Handles: Polling • Writing • Retries<br/>Data Conversion • Byte Swap • Display Formatting</i>"]

    MAP ==> TABLE
    TABLE ==> ENGINE

    NOTE1["The entire table = <b>Modbus Map/List</b>"]
    NOTE2["Each row = One <b>Monitor Point</b>"]

    TABLE -.-> NOTE1
    TABLE -.-> NOTE2

    style MAP fill:#e3f2fd,stroke:#1976d2,stroke-width:3px,color:#000
    style TABLE fill:#f5f5f5,stroke:#666,stroke-width:2px
    style HEADER fill:#2196f3,stroke:#1565c0,stroke-width:2px,color:#fff
    style ROW1 fill:#fff,stroke:#90caf9,stroke-width:1px
    style ROW2 fill:#fff,stroke:#90caf9,stroke-width:1px
    style ROW3 fill:#fff,stroke:#90caf9,stroke-width:1px
    style ROW4 fill:#fff,stroke:#90caf9,stroke-width:1px
    style ENGINE fill:#c8e6c9,stroke:#388e3c,stroke-width:3px,color:#000
    style NOTE1 fill:#fff9c4,stroke:#f57f17,stroke-width:2px
    style NOTE2 fill:#fff9c4,stroke:#f57f17,stroke-width:2px
Modbus Map / List: The Modbus Map (or Monitor Points List) is the complete collection of data points you want to communicate with on a Modbus device. Think of it as your “register shopping list” — a centralized view showing all Modbus addresses you plan to read or write. Each entry in this list includes its address, function code, data type, and optional pre- or post-processing settings. Together, these entries form a dictionary of Modbus data that defines what the XPF application will handle. XPF then automatically manages polling, writing, retries, data conversions, byte-swapping, and display formatting across the entire list.
Monitor Point: A Monitor Point is a single data entry within the Modbus Map — representing one Modbus register or coil you want to read or write. You configure its details (address, function code, data type, scaling, and optional pre/post-processing). Each Monitor Point operates as an independent tag, allowing you to precisely define what data you want and how it should be processed. XPF then performs all background operations for that point: polling, retrying, converting, swapping bytes if needed, and displaying formatted values.
Modbus Map and Monitor Points - Practical Example
Understanding the relationship between Modbus Map and Monitor Points:
| NAME | ADDRESS | UNIT ID | GAIN | OFFSET | DATA TYPE | SWAP TYPE | VALUE |
|---|---|---|---|---|---|---|---|
| Motor Speed | 400001 |
1 | 1.00000 | 0.00000 | UINT16 | ABCD_BE | 1450 |
| Line Voltage | 300001 |
1 | 1.00000 | 0.00000 | INT16 | ABCD_BE | 230 |
| Pump Status | 100001 |
1 | 1.00000 | 0.00000 | BIT | ABCD_BE | 1 |
| Coil Register | 000001 |
1 | 1.00000 | 0.00000 | BIT | ABCD_BE | 1 |
Key Points:
- The entire table above represents your Modbus Map/List
- Each row (e.g., Motor Speed, Line Voltage) represents one Monitor Point
- Each Monitor Point has all 8 columns: NAME, ADDRESS (6-digit), UNIT ID, GAIN, OFFSET, DATA TYPE, SWAP TYPE, VALUE
- Address format:
4xxxxx=Holding Reg |3xxxxx=Input Reg |1xxxxx=Discrete Input |0xxxxx=Coil - XPF automatically handles all polling, conversions, and formatting for every Monitor Point in the list
Client vs Server Mode:
- Client (Master) - You initiate communication, continuously polling remote devices for data
- Server (Slave) - You simulate a Modbus device, responding to requests from other masters
- Simultaneous Operation - Both modes can run at the same time on different interfaces
XPF Functionality Architecture:
XPF initiates communication to read/write data from remote Modbus devices
graph LR
    subgraph MAPLIST["Modbus Map"]
        direction TB
        ADDR1["40001 | Read Holding | INT16<br/>Motor Speed RPM"]
        ADDR2["40002 | Read Holding Reg | FLOAT32<br/>Line Voltage V"]
        ADDR3["00001 | Read Coil | BOOL<br/>Pump Running Status"]

        ADDR1 ~~~ ADDR2 ~~~ ADDR3
    end

    subgraph XPF["XPF - CLIENT MODE"]
        direction TB
        MAPLIST
        ENGINE["Polling Engine"]
    end

    PLC["PLC<br/>Holding Registers<br/>192.168.1.10 or RTU"]
    VFD["VFD Drive<br/>Speed Control<br/>192.168.1.10 or RTU"]
    METER["Energy Meter<br/>Power Data<br/>192.168.1.10 or RTU"]

    XPF -->|"(1) Send Read Request<br/>Modbus TCP"| PLC
    PLC -->|"(2) Return Data<br/>Register Values"| XPF

    XPF -->|"(1) Send Read Request<br/>Modbus RTU"| VFD
    VFD -->|"(2) Return Data<br/>Speed, Status"| XPF

    XPF -->|"(1) Send Read Request<br/>Modbus TCP"| METER
    METER -->|"(2) Return Data<br/>Voltage, Current"| XPF

    style XPF fill:#e3f2fd,stroke:#1976d2,stroke-width:4px
    style MAPLIST fill:#fff,stroke:#1976d2,stroke-width:2px
    style ADDR1 fill:#f5f5f5,stroke:#90caf9,stroke-width:1px
    style ADDR2 fill:#f5f5f5,stroke:#90caf9,stroke-width:1px
    style ADDR3 fill:#f5f5f5,stroke:#90caf9,stroke-width:1px
    style ENGINE fill:#bbdefb,stroke:#1976d2,stroke-width:2px
    style PLC fill:#fff9c4,stroke:#ff6f00,stroke-width:2px
    style VFD fill:#fff9c4,stroke:#ff6f00,stroke-width:2px
    style METER fill:#fff9c4,stroke:#ff6f00,stroke-width:2px
Client Mode Flow:
- Configure Monitor Points - Define which registers/coils to read/write
- XPF sends requests - Polls devices according to configured timing
- Devices respond - Send back register values, coil states
- XPF processes data - Apply scaling, byte swapping, display formatting
- Log communication - Track all transactions for troubleshooting
Use Cases: Monitor PLCs, read sensor data, control VFDs, commissioning systems
XPF responds to requests from external Modbus masters (SCADA, HMI, PLC)
graph RL
    subgraph XPF["XPF - SERVER MODE"]
        direction TB
        LISTEN["Server Listener"]
        SVRDATA
    end

    subgraph SVRDATA["Modbus Map"]
        direction TB
        REG1["40001 | Holding | INT16<br/>Process Value 1"]
        REG2["40002 | Holding | FLOAT32<br/>Temperature C"]
        REG3["00001 | Coil | BOOL<br/>Alarm Status"]

        REG1 ~~~ REG2 ~~~ REG3
    end

    SCADA["SCADA System<br/>TCP Client<br/>192.168.1.100"]
    HMI["HMI Panel<br/>RTU Client<br/>COM2"]
    PLCM["PLC Master<br/>TCP Client<br/>192.168.1.50"]

    SCADA -->|"(1) Send Read Request<br/>Modbus TCP"| XPF
    XPF -->|"(2) Return Data<br/>From Data Table"| SCADA

    HMI -->|"(1) Send Read Request<br/>Modbus RTU"| XPF
    XPF -->|"(2) Return Data<br/>Register Values"| HMI

    PLCM -->|"(1) Send Write Request<br/>Function 06/16"| XPF
    XPF -->|"(2) Confirm Write<br/>Update Data Table"| PLCM

    style XPF fill:#e8f5e9,stroke:#388e3c,stroke-width:4px
    style SVRDATA fill:#fff,stroke:#388e3c,stroke-width:2px
    style REG1 fill:#f5f5f5,stroke:#81c784,stroke-width:1px
    style REG2 fill:#f5f5f5,stroke:#81c784,stroke-width:1px
    style REG3 fill:#f5f5f5,stroke:#81c784,stroke-width:1px
    style LISTEN fill:#c8e6c9,stroke:#388e3c,stroke-width:2px
    style SCADA fill:#fce4ec,stroke:#c2185b,stroke-width:2px
    style HMI fill:#fce4ec,stroke:#c2185b,stroke-width:2px
    style PLCM fill:#fce4ec,stroke:#c2185b,stroke-width:2px
Server Mode Flow:
- Configure Server Data - Set up registers, coils, and initial values
- External master sends request - SCADA/HMI asks for data
- XPF processes request - Validates function code, address range
- XPF sends response - Provides requested data or write confirmation
- Log transaction - Track all requests for analysis
Use Cases: Simulate devices for testing, act as protocol gateway, development without hardware
Simultaneous Operation - Run Both Modes Together
XPF can operate as Client AND Server at the same time:
- Client mode reads data from real PLCs (Modbus TCP on port 502)
- Server mode provides that data to SCADA (Modbus RTU on COM1)
- Each mode uses independent interface configuration
- Perfect for protocol conversion, testing, or acting as a data bridge
Magic Codes: Special text you add to the Name field of monitor points to enable advanced features like custom poll rates, bit field access, string length control, and date/time conversion (covered in detail in Monitor Points Configuration section).
Dual Functionality: XPF can operate as both Client and Server simultaneously, making it ideal for testing client-server interactions on a single PC without physical devices.
Navigation TipsQuick Access Toolbar Customization:
| Action | Method | Details |
|---|---|---|
| Open Customization Menu | Right-click anywhere on toolbar | Shows complete list of available buttons (11 options) |
| Add/Remove Buttons | Click button name in menu | Checkmark indicates button is currently visible |
Customization Best Practices:
- Add buttons you use frequently - Start, Stop, Read, Save, Show
- Remove rarely-used buttons - Keep toolbar uncluttered for faster access
- Field work setup - Save, Read, Start, Stop, Show (essential operations only)
- Development setup - Add Chart, Write for testing and analysis work
- Position preference - Below ribbon if you prefer buttons closer to data area
Right-click Context Menus:
| Feature | Usage | Behavior |
|---|---|---|
| Table Context Menus | Right-click any table row | Relevant actions for selected item |
| Field Context Menus | Right-click input fields | Field-specific operations |
| Adaptive Menus | Context-sensitive | Options change based on selection |
Keyboard Shortcuts:
| Shortcut | Function | Usage |
|---|---|---|
Ctrl+S |
Save configuration | Preserve current setup |
Ctrl+O |
Open configuration | Load saved file |
Ctrl+C / Ctrl+V |
Copy/paste | Works with Excel integration |
Ctrl+X |
Cut rows | Move selected items |
Shift+Click |
Select range | Sequential row selection |
Ctrl+Click |
Multi-select | Non-sequential rows |
Window Portal Switching:
| Feature | Method | Result |
|---|---|---|
| View Toggle | Ribbon button clicks | Switch between Monitor Points, Log, Chart, Online Maps |
| Shared Space | Same screen area | Each view replaces previous in portal |
| Data Persistence | Background retention | Switching views doesn't lose data |
Workflow Best Practice
- Set up your monitor points first (define what you want to read/write)
- Configure communication settings (TCP/Serial, timeouts)
- Save your configuration before starting polling
- Test with "Read Once" before enabling continuous polling
- Save frequently - especially before making major changes
Key Concepts
Modbus Map / List: The Modbus Map (or Monitor Points List) is the complete collection of data points you want to communicate with on a Modbus device. Think of it as your "register shopping list" — a centralized view showing all Modbus addresses you plan to read or write. Each entry in this list includes its address, function code, data type, and optional pre- or post-processing settings. Together, these entries form a dictionary of Modbus data that defines what the XPF application will handle. XPF then automatically manages polling, writing, retries, data conversions, byte-swapping, and display formatting across the entire list. See Monitor Points Configuration for complete setup details.
Monitor Point: A Monitor Point is a single data entry within the Modbus Map — representing one Modbus register or coil you want to read or write. You configure its details (address, function code, data type, scaling, and optional pre/post-processing). Each Monitor Point operates as an independent tag, allowing you to precisely define what data you want and how it should be processed. XPF then performs all background operations for that point: polling, retrying, converting, swapping bytes if needed, and displaying formatted values.
Modbus Map and Monitor Points - Practical Example
Understanding the relationship between Modbus Map and Monitor Points:
| NAME | ADDRESS | UNIT ID | GAIN | OFFSET | DATA TYPE | SWAP TYPE | VALUE |
|---|---|---|---|---|---|---|---|
| Motor Speed | 400001 |
1 | 1.00000 | 0.00000 | UINT16 | ABCD_BE | 1450 |
| Line Voltage | 300001 |
1 | 1.00000 | 0.00000 | INT16 | ABCD_BE | 230 |
| Pump Status | 100001 |
1 | 1.00000 | 0.00000 | BIT | ABCD_BE | 1 |
| Coil Register | 000001 |
1 | 1.00000 | 0.00000 | BIT | ABCD_BE | 1 |
Key Points:
- The entire table above represents your Modbus Map/List
- Each row (e.g., Motor Speed, Line Voltage) represents one Monitor Point
- Each Monitor Point has all 8 columns: NAME, ADDRESS (6-digit), UNIT ID, GAIN, OFFSET, DATA TYPE, SWAP TYPE, VALUE
- Address format:
4xxxxx=Holding Reg |3xxxxx=Input Reg |1xxxxx=Discrete Input |0xxxxx=Coil - XPF automatically handles all polling, conversions, and formatting for every Monitor Point in the list
Client vs Server Mode:
- Client (Master) - You initiate communication, continuously polling remote devices for data
- Server (Slave) - You simulate a Modbus device, responding to requests from other masters
- Simultaneous Operation - Both modes can run at the same time on different interfaces
Magic Codes: Special text you add to the Name field of monitor points to enable advanced features like custom poll rates, bit field access, string length control, and date/time conversion (covered in detail in Monitor Points Configuration section).
Dual Functionality: XPF can operate as both Client and Server simultaneously, making it ideal for testing client-server interactions on a single PC without physical devices.
Navigation Tips
Quick Access Toolbar Customization:
| Action | Method | Details |
|---|---|---|
| Open Customization Menu | Right-click anywhere on toolbar | Shows complete list of available buttons (11 options) |
| Add/Remove Buttons | Click button name in menu | Checkmark indicates button is currently visible |
Customization Best Practices:
- Add buttons you use frequently - Start, Stop, Read, Save, Show
- Remove rarely-used buttons - Keep toolbar uncluttered for faster access
- Field work setup - Save, Read, Start, Stop, Show (essential operations only)
- Development setup - Add Chart, Write for testing and analysis work
- Position preference - Below ribbon if you prefer buttons closer to data area
Right-click Context Menus:
| Feature | Usage | Behavior |
|---|---|---|
| Table Context Menus | Right-click any table row | Relevant actions for selected item |
| Field Context Menus | Right-click input fields | Field-specific operations |
| Adaptive Menus | Context-sensitive | Options change based on selection |
Keyboard Shortcuts:
| Shortcut | Function | Usage |
|---|---|---|
Ctrl+S |
Save configuration | Preserve current setup |
Ctrl+O |
Open configuration | Load saved file |
Ctrl+C / Ctrl+V |
Copy/paste | Works with Excel integration |
Ctrl+X |
Cut rows | Move selected items |
Shift+Click |
Select range | Sequential row selection |
Ctrl+Click |
Multi-select | Non-sequential rows |
Window Portal Switching:
| Feature | Method | Result |
|---|---|---|
| View Toggle | Ribbon button clicks | Switch between Monitor Points, Log, Chart, Online Maps |
| Shared Space | Same screen area | Each view replaces previous in portal |
| Data Persistence | Background retention | Switching views doesn't lose data |
Workflow Best Practice
- Set up your monitor points first (define what you want to read/write)
- Configure communication settings (TCP/Serial, timeouts)
- Save your configuration before starting polling
- Test with "Read Once" before enabling continuous polling
- Save frequently - especially before making major changes
| Online | Download Modbus Maps from online folder or community | Access pre-configured maps from (1) factory-released validated maps or (2) community-uploaded maps. See detailed explanation below and Modbus Device Maps Start Page for model previews. |
CSV Format Benefits
XPF saves configurations as standard CSV files, making them easy to:
- Edit in Excel or text editors for batch modifications
- Version control using Git or other systems
- Share with team members or across sites
- Document device configurations for compliance
Clipboard Group
Copy and Paste Operations - Transfer data between XPF and external applications like Excel. Copy, paste, and cut monitor points for quick duplication or reorganization.
| Operation | Shortcut | Description |
|---|---|---|
| Paste | Ctrl+V |
Paste from clipboard from selected row(s) - either from the application or Microsoft Excel. Adds to end of list. |
| Copy | Ctrl+C |
Copy selected single or multiple row(s) to clipboard. Multiple sequential rows can be selected with Shift+Click's first and last row. Multiple rows in any order using Control+Click. |
| Cut | Ctrl+X |
Copy the content of the current item to clipboard and delete the item from the list. |
Modbus Wizard
The Modbus Wizard provides a streamlined interface for configuring monitor points without manually editing the table. Access it by clicking the Dialog Launcher (small arrow) in the Modbus Wizard group corner.
Modbus Wizard configuration interface
Configuration Fields:
| Field | Purpose | Options/Format |
|---|---|---|
| Register Name | Descriptive identifier | Text field - name your monitor point |
| Modbus Function | Register type and access | See Address Field - 6-Digit Format in Monitor Points Configuration |
| Sub-Function | Function variant (FC8 only) | Appears for FC8 Diagnostics - e.g., "0 (0x0) Return Query Data" |
| Device ID | Device identification type (FC43-14 only) | Appears for FC43-14 - e.g., "01 Get Basic Device ID (stream)" |
| Object ID | MEI object identifier (FC43-14 only) | Appears for FC43-14 - Object number (00-FF hexadecimal) |
| CustomQ | Custom Modbus Packet | Add PDU part of the Modbus Command to send any command |
| Data Request | Request address/value | Address or data value for the request |
| Address | Modbus Address | Zero or One based Modbus Address (see 6-digit format) |
| Data Type | Data interpretation | See Data Type Options in Monitor Points Configuration |
| Poll Rate Control | Update frequency | NONE, SKIP, ONCE, INTERVAL (Adjust Poll Rate value) |
| Bit Field | Extract specific bit | 0-15 for 16-bit registers - selects individual bit |
| Write Only | Skip during reads | Checkbox - for write-only registers |
Function-Specific Fields
The wizard dynamically displays additional fields based on the selected Modbus Function:
- FC8 Diagnostics: Shows
Sub-Functiondropdown with diagnostic test options - FC43-14 Read Device Identification: Shows
Device IDandObject IDfields for MEI object selection - These fields only appear when their corresponding function is selected
Quick Reference
For complete details, see the Monitor Points Configuration section:
- Magic Codes - String length, poll rates, bit access, date/time formats
- Address Format - 6-digit addressing explained with examples
- Data Types - All supported data types and their usage
- Custom Commands - Send raw Modbus PDU commands
- Chart Options - Real-time data visualization
- Simulate Mode - Generate test data patterns
How to Use:
- View Existing Point: Click any row in Monitor Points table - Wizard displays current settings
- Edit Configuration:
- Select row to edit
- Change values in Wizard dropdowns/fields
- Click OK to apply changes
- Add New Point:
- Click empty row or Add button
- Fill in Register Name
- Select Modbus Function from dropdown
- Configure Data Type and optional settings
- Click OK to create
Common Scenarios:
Setup:
- Register Name: Device Model
- Modbus Function: FC43 (0x2B) Encapsulated Interface Transport
- CustomQ: 28 (typical string length)
- Data Type: BIT or STRING
Result: Reads device identification strings (manufacturer, model, version)
Setup:
- Register Name: Water Temp
- Modbus Function: FC04 (0x04) Input Registers
- Data Type: INT16 or FLOAT32
- Poll Rate Control: NONE (default polling)
Result: Continuous monitoring of read-only temperature value
Setup:
- Register Name: High Temp Alarm
- Modbus Function: FC02 (0x02) Discrete Inputs
- Data Type: BIT
- Bit Field: 5 (extracts bit 5)
Result: Monitors specific alarm bit in status register
Setup:
- Register Name: Target Speed
- Modbus Function: FC03 (0x03) Holding Registers
- Data Type: UINT16
- Write Only: Unchecked (read and write)
Result: Bidirectional control - read current setpoint, write new values
Wizard Advantages
Why use the Wizard instead of direct table editing:
- Validation: Ensures valid combinations of function codes and data types
- Guided Setup: Dropdown menus prevent common configuration errors
- No Syntax Errors: Automatically formats addresses and codes correctly
- Beginner Friendly: Visual interface easier than memorizing Modbus specifications
- Quick Changes: Faster than navigating table columns for adjustments
List Group
Add and Remove Points - Add, remove, or modify monitor points in bulk. Change addressing modes (0-based/1-based), swap Unit IDs globally, or set decimal precision for all numeric displays.
The List Group provides essential tools for managing your Monitor Points (also called Rows or Items) in the configuration table:
| Button | Function | Description |
|---|---|---|
| Add | Add new point | Creates new row with default values. Automatically increments address by one from the last row for quick sequential entry. |
| Remove | Delete selected point(s) | Removes selected monitor point(s) from the table. Select multiple with Ctrl+Click (non-sequential) or Shift+Click (range). |
| Delete All | Clear entire list | Removes ALL monitor points from the table. Use with caution - this action cannot be undone! |
| Offset | Toggle address base | Switch between 1-based (1-65536) and 0-based (0-65535) addressing for all addresses in the list. |
| Swap ID | Change Unit ID globally | Updates Unit ID (Slave/Station ID) for all monitor points at once. Useful when reconfiguring for a different device. |
| Decimal Places | Set display precision | Configure the number of decimal places for displaying numeric values throughout the application. |
Typical Workflow
Adding multiple consecutive registers:
- Add first register at address 400001
- Click Add (+) - automatically creates 400002
- Click Add (+) again - creates 400003
- Continue as needed - each Add increments by one
Bulk ID changes:
- If you need to change all monitor points from Slave ID 1 to Slave ID 5
- Simply click ID button and enter 5
- All monitor points update immediately
Filter Group
Search and Filter Monitor Points - Search Name and Address fields to quickly locate specific monitor points. Filter large lists by text search or Unit ID to focus on relevant registers during troubleshooting or configuration.
Filter Components:
| Label | Component | Description |
|---|---|---|
| 1 | Row Index | Shows the index of the currently selected row. Especially useful when the list is filtered to know the true row number. -1 when none Selected. |
| 2 | Filter Text Box | Enter text to search. Filters all Name and Address fields that contain the entered text. |
| 3 | Total Rows | Shows the total number of rows in the current view (filtered or full list). |
| 4 | Clear Filter | Clears the text filter and shows all rows in the list. |
| 5 | Clear ID | Clears the ID filter and shows all rows in the list. |
| 6 | ID Dropdown | Select Unit ID (Slave ID or Station ID) to filter by device. Combine with text filter for precise results. |
How Filtering Works
Text Search: - Type any text in the filter box - Results show all monitor points where Name OR Address contains your search text - Case-insensitive search - Use partial matches (e.g., "temp" finds "Temperature", "temp_sensor", "Water Temp")
ID Filter: - Select specific Unit ID from dropdown - Shows only monitor points for that device - Combine with text filter for double-filtering
Combined Example:
- Filter Text: status
- ID: 3
- Result: Only status-related registers from Unit ID 3
Common Filter Scenarios
Finding all temperature sensors:
Working with specific device:
Precise targeting:
Evaluate Group Details
Value Validation and Testing - Validate register values against configurable limits with automatic color coding. Set pass/fail thresholds for quality control testing or equipment health monitoring.
Change the background colors of the Value cell based on the High, Low, and Nominal Limits. Quickly validate the value from the Modbus device and test to see if it is within the valid range.
Key Features:
- Automatic color coding - Visual status at a glance (Red/Green/Blue/Gray)
- Configurable limits - Set High, Low, and Nominal thresholds per register
- Real-time evaluation - Instant color updates as values change during polling
- Filter by status - Show only High, Low, or Nominal registers
- Quick value assignment - Save current value as High or Low Limit with one click
- Boolean evaluation - Automatic status calculation without complex expressions
Complete Controls Reference:
| Control | Type | ToolTip | Use When | Status Color |
|---|---|---|---|---|
| Show | Toggle Button | Show/hide all other Evaluate options and controls | You want to access High/Low/Nominal/Auto filters | - |
| High Filter | Toggle Button | Filter: Show only rows where value has exceeded the High Limit. Red status indicates out-of-range high condition." | Testing upper bounds or identifying overhigh values | Red |
| Nominal Filter | Toggle Button | Filter: Show only rows where value is between Low Limit and High Limit (normal operating range). Green status indicates normal condition. | Monitoring normal operation or quality control pass tests | Green |
| Low Filter | Toggle Button | Filter: Show only rows where value is below the Low Limit. Blue status indicates out-of-range low condition. | Testing lower bounds or identifying underlow values | Blue |
| Auto Toggle | Toggle Button | Auto-evaluate: When enabled, filter updates automatically after each scan cycle without manual intervention. When disabled, manually toggle filters to refresh. | You want automatic status updates as data arrives | - |
| Test/Evaluate | Toggle Button | Toggle evaluation ON/OFF. When ON, each register's limit status (High/Nominal/Low) is calculated and displayed with color coding. When OFF, no evaluation occurs. Status indicator shows current mode. | You want to enable or disable all evaluation color coding | Gray (off) / Color (on) |
| Save as High Limit (current row) | Menu Button | Saves the currently selected row's value as its High Limit. Use when a single register reaches its maximum safe operating value." | You want to capture the highest observed value as the threshold for only the selected register | - |
| Save as Low Limit (current row) | Menu Button | Saves the currently selected row's value as its Low Limit. Use when a single register reaches its minimum safe operating value." | You want to capture the lowest observed value as the threshold for only the selected register | - |
| Save as High Limit (all rows) | Menu Button | Saves the currently selected row's value as the High Limit for all register rows in the list. Use when you want to apply the same high threshold across all equipment parameters. | You want to apply the same high threshold value to all registers at once | - |
| Save as Low Limit (all rows) | Menu Button | Saves the currently selected row's value as the Low Limit for all register rows in the list. Use when you want to apply the same low threshold across all equipment parameters. | You want to apply the same low threshold value to all registers at once | - |
How Evaluation Works:
| Condition | Status | Color | Display |
|---|---|---|---|
| Value ≥ High Limit | Out-of-Range High | Red | Value cell background turns red |
| Low Limit < Value < High Limit | Normal/Nominal | Green | Value cell background turns green |
| Value ≤ Low Limit | Out-of-Range Low | Blue | Value cell background turns blue |
| Evaluate OFF | Not Evaluated | Gray | Value cell shows normal (no color) |
Common Workflows:
Objective: Establish High/Low limits by observing real device behavior
- Click Test/Evaluate button to turn ON evaluation
- Click Show to display filter controls
- Let device run under normal conditions while observing values
- When value reaches maximum safe level, select that row and click Save as High Limit
- When value reaches minimum safe level, select that row and click Save as Low Limit
- Verify status shows Green (Nominal) for normal operations
- Result: Limits are now calibrated to your specific equipment
Objective: Quickly identify out-of-spec registers on a single device
- Verify Test/Evaluate is ON
- Click Show to display filters
- Select the Auto toggle to enable automatic updates
- Toggle High Filter to see only values exceeding maximum
- Investigate displayed registers - these indicate overtemperature, overpressure, overspeed, etc.
- Toggle Low Filter to check values below minimum (undertemp, low pressure, low speed)
- Use color coding as visual guide: Red=High, Blue=Low, Green=Normal
- Result: Problematic registers highlighted for investigation
Objective: Validate new equipment meets specifications before deployment
- Import manufacturer specifications into High/Low/Nominal limits for each register
- Click Test/Evaluate to turn ON
- Click Auto to enable automatic filter updates
- Run equipment through full operating range (startup, normal, shutdown)
- Observe color changes:
- Green throughout = Pass ✓
- Red or Blue = Out of spec = Fail ✗
- Adjust equipment settings if limits exceeded
- Re-run until all registers stay Green during full cycle
- Result: Equipment validated and ready for production deployment
Troubleshooting:
| Issue | Cause | Solution |
|---|---|---|
| No colors appearing | Test/Evaluate is OFF | Click Test/Evaluate button to toggle ON |
| Colors not updating | Auto is disabled | Click Auto toggle to enable automatic updates, or manually toggle filters |
| Wrong limits set | Previous calibration incorrect | Select row, click Save as High/Low to capture new values, or edit limits manually |
| Filter not working | Show button is OFF, filters hidden | Click Show button to display High/Low/Nominal/Auto controls |
| String evaluation fails | Mismatched case or spacing | For strings, High Limit and Low Limit must be identical and match exactly (case-sensitive) |
Tips & Best Practices:
- ✅ Use Auto toggle for real-time monitoring - colors update automatically as data changes
- ✅ Save values during normal operation - Use Save as High/Low when equipment is running at actual min/max
- ✅ Combine with Filter - Focus investigation on out-of-spec registers only
- ✅ Document limits - Save your CSV configuration file after setting limits for reuse on other devices
- ✅ Color-code by status - Customize Nominal/High/Low colors to match your facility standards
- ❌ Don't manually type limits for exact values - Use Save buttons for precision, avoid rounding errors
Evaluate Limits Settings (Per Monitor Point)
Fine-tune validation thresholds for individual monitor points. Each point can have custom limits and color coding independent of others in your list.
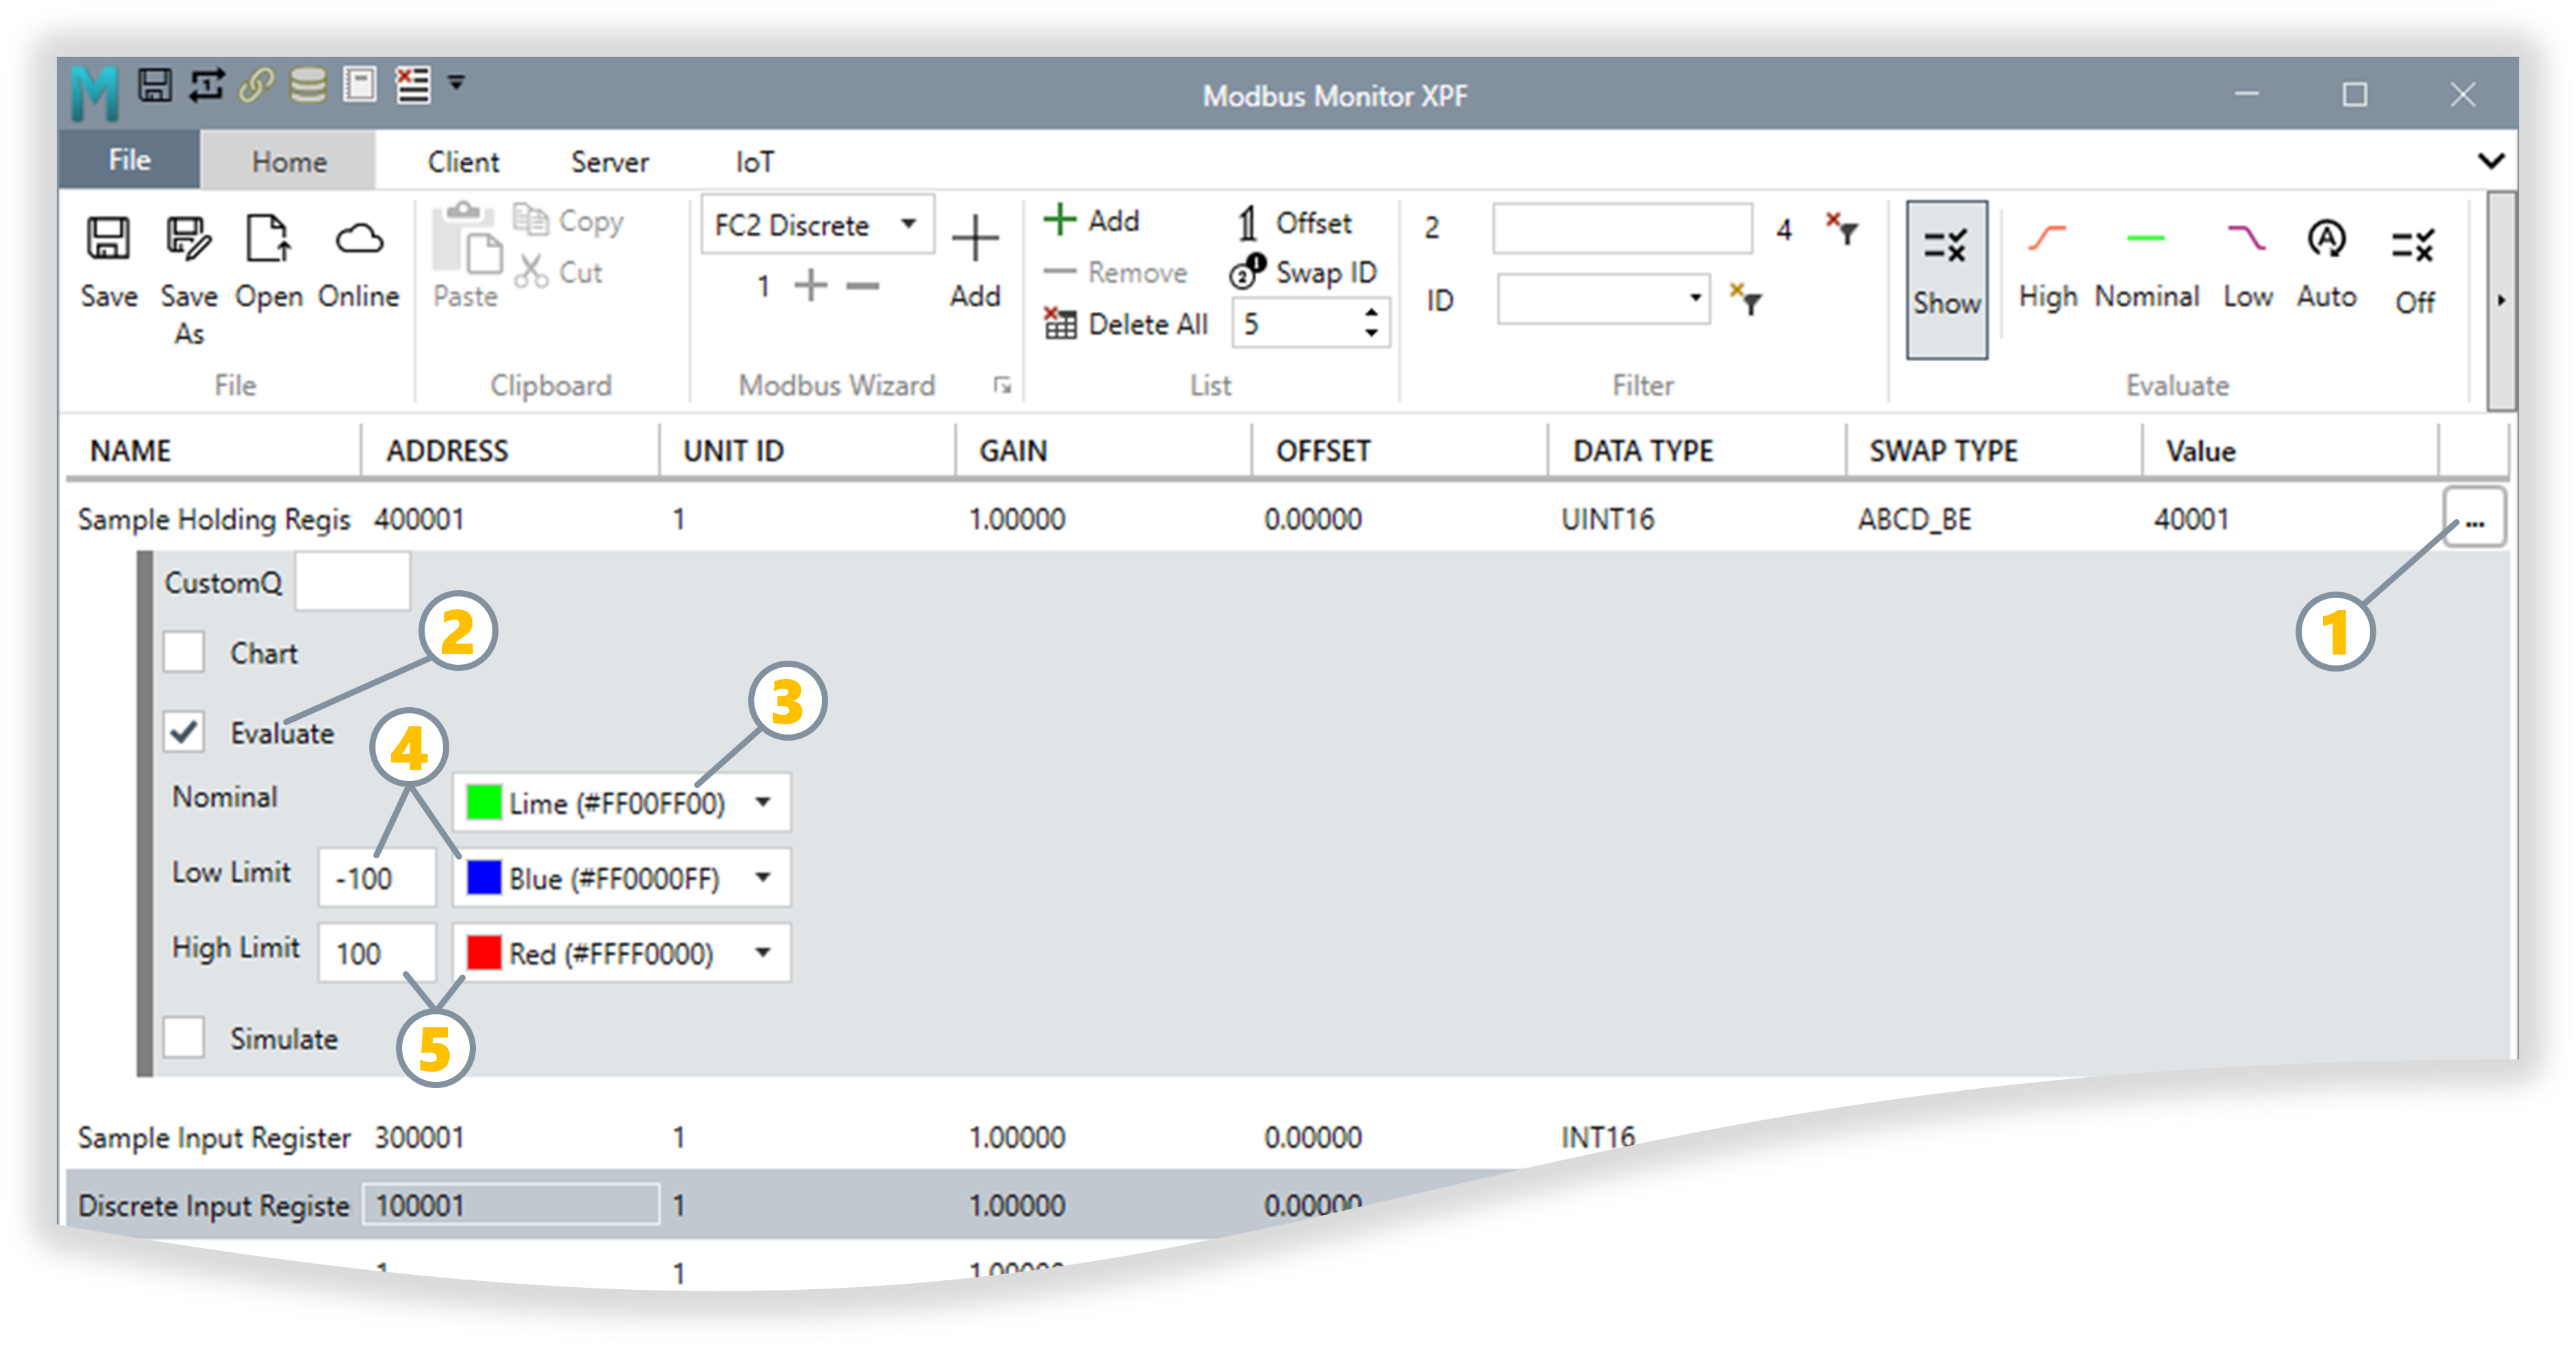
Click the three dots (...) button at the end of any monitor point row to open the Evaluate Limits dialog shown above.
| Label | Setting | Options | Description |
|---|---|---|---|
| 1 | Three Dots (...) | Button | Opens the Evaluate Limits settings dialog for this monitor point |
| 2 | Evaluate | Checkbox | Turn the Evaluate feature on or off for this specific monitor point |
| 3 | Nominal Color | Color picker | Choose a color for the Nominal Value range. The nominal range is calculated as values between the Low Limit and High Limit. |
| 4 | Low Limit | Value + Color | Choose a color to highlight the Value column when the value equals or falls below the Low Limit. The value can be numerical or string type. |
| 5 | High Limit | Value + Color | Choose a color to highlight the Value column when the value equals or exceeds the High Limit. The value can be numerical or string type. |
| 4 + 5 | String Mode | Same High/Low | For String Data Type, set the same High and Low Limit for exact string matching |
Practical Applications
Quality Control Testing:
- Set High Limit: 100, Low Limit: 0, Nominal: Green
- Values 0-100 show green (pass)
- Values outside range show red/yellow (fail)
- Instant visual validation during production testing
Equipment Health Monitoring:
- Motor temperature: High=80°C (Red), Low=10°C (Blue), Nominal=Green
- Pressure sensor: High=150 PSI (Red), Nominal=Green
- Quick identification of out-of-spec conditions
String Validation:
- Device status should be "RUNNING"
- Set High Limit = Low Limit = "RUNNING", Nominal Color = Green
- Any other status shows as error color
Log Group
Communication Monitoring and Logging - View and record all Modbus communication traffic for troubleshooting. Filter errors, export logs to file, and timestamp all events for accurate diagnostics.
Four key areas: 1 Log Group (Home Tab), 2 Options Tab, 3 Quick Access Header (3a-3h), 4 Log Window
Complete Log Controls Reference:
All log controls in one comprehensive table. Labels 1, 2, 3a-3h, and 4 correspond to the screenshot above.
| Label | Control | Location | Type | Function |
|---|---|---|---|---|
| 1 | Show | Home Tab → Log Group | Toggle Button | Show/hide Event Log view. Pressed: Replaces Monitor Points table with log display, Options tab appears. Released: Returns to Monitor Points table. |
| 2 | Log/Options Tab | Contextual Ribbon | Dynamic Tab | Appears when log is active. Contains logging and filter controls. Disappears when log closed (logging continues in background if started). |
| 2 | Filter | Quick Access Header or Options Tab | Text Input Box | Real-time text search. Type to filter log entries, clear to show all. Case-insensitive search. |
| 2 | Errors | Options Tab | Toggle Button | Checked: Show errors only (timeouts, exceptions). Unchecked: Show all events (success + errors). |
| 3a or 2 | Start/Stop | Quick Access Header or Options Tab | Toggle Button | Start: Begin capturing events. Stop: Pause recording. Auto-resumes if saved while running. |
| 3b or 2 | Auto Save | Quick Access Header or Options Tab | Toggle Button | ON: Continuously writes log to Documents folder. OFF: Logs remain in memory only. |
| 3c or 2 | Copy All | Quick Access Header or Options Tab | Button | Export all visible log entries to clipboard (timestamp + details). Paste into Excel, email, or text editor. Click on any log entry to enable this button. |
| 3d or 2 | Clear | Quick Access Header or Options Tab | Button | Delete all log entries from display. Warning: Cannot be undone. Save or copy important logs first. |
| 3e | Save | Quick Access Header | Button | Save current log entries to a file in Documents folder. |
| 3f | Float | Quick Access Header | Button | Float the Log window outside the application's main window as a separate window. |
| 3g | Expand | Quick Access Header | Button | Expand log window to full screen or restore to normal size. |
| 3h or 2 | Close | Quick Access Header or Options Tab | Button | Close Log Window and return to Monitor Points (logging continues in background if started). |
| 4 | Log Window | Window Portal Area | Display Panel | Shows timestamped communication events. Replaces Monitor Points table when log is active. |
Quick Start Workflow
- Click Show (1) → Log window appears (4), Options tab (2) opens
- Click Start (3a) → Begin recording Modbus traffic
- Optional: Toggle Errors (3f) or type in Filter (3g) to focus on specific events
- Click Copy All (3b) to export, or Save (3d) for continuous file backup
- Click Clear (3c) between test runs to remove old entries
- Click Close (3e) or Show (1) again to return to Monitor Points
Log Entries Display (Window Portal Area)
Where Log Entries Appear - When you click the Show button (1), the Window Portal Area (the main workspace below the ribbon) switches from showing the Monitor Points table to displaying the Event Log.
Log Entry Display Characteristics:
| Feature | Description | Details |
|---|---|---|
| Location | Window Portal Area | Same area where Monitor Points table normally displays |
| Entry Format | Timestamped rows | Each log entry shows: Timestamp • Event Type • Details • Status |
| Timestamps | UTC format | All events time-stamped with UTC for accurate correlation across time zones |
| Auto-Update | Real-time | New entries appear immediately as communication occurs (when logging is started) |
| Scroll View | Vertical scrolling | Older entries scroll up as new ones arrive at bottom |
| Capacity | Memory-based | Limited to 10000 entries before deleting old items (clear periodically for performance) |
What Gets Logged:
- Modbus Requests: Function code, address, unit ID, data sent
- Modbus Responses: Data received, byte count, success/failure status
- Communication Errors: Timeouts, CRC errors, exception codes, connection failures
- System Events: Connection established/closed, configuration changes, poll cycle start/stop
- Timestamps: Precise timing for troubleshooting timing-related issues
Sample Log Entries
Complete Poll Cycle with System Events:
07:19:56:511585, Poll Once: True
07:19:56:766466, Client-STARTING
07:19:58:820433, Server Found 127.0.0.1:502
07:19:58:825077, Client-RUNNING
Successful Read (Holding Registers):
07:19:58:833472, TCP TX, 00 01 00 00 00 06 01 03 00 00 00 01, Read Holding Registers, SID:1, FC:3, ADR:0, CNT:1
07:19:58:861535, TCP RX, 00 01 00 00 00 05 01 03 02 00 00
Modbus Exception Error 1 - Illegal Function (Input Registers):
07:19:58:908104, TCP TX, 00 02 00 00 00 06 01 04 00 00 00 01, Read Input Registers, SID:1, FC:4, ADR:0, CNT:1
07:19:58:923572, TCP RX, 00 02 00 00 00 03 01 84 01
07:19:58:926070, Illegal Function, ERR:1, SID:1 FC:84, Sample Input Register, 300001, 1, 1, 0, INT16, ABCD_BE, 30001,,
Modbus Exception Error 1 - Illegal Function (Discrete Inputs):
07:19:58:955758, TCP TX, 00 03 00 00 00 06 01 02 00 00 00 01, Read Inputs Registers, SID:1, FC:2, ADR:0, CNT:1
07:19:58:970172, TCP RX, 00 03 00 00 00 03 01 82 01
07:19:58:970512, Illegal Function, ERR:1, SID:1 FC:82, Discrete Input Register, 100001, 1, 1, 0, BIT, ABCD_BE, 1,,
Modbus Exception Error 1 - Illegal Function (Coils):
07:19:59:001799, TCP TX, 00 04 00 00 00 06 01 01 00 00 00 01, Read Coils, SID:1, FC:1, ADR:0, CNT:1
07:19:59:016788, TCP RX, 00 04 00 00 00 03 01 81 01
07:19:59:017054, Illegal Function, ERR:1, SID:1 FC:81, Coil Register, 1, 1, 1, 0, BIT, ABCD_BE, 1,,
Client Stop:
Viewing Tips:
- Recent entries appear at bottom - Scroll down to see latest events
- Filtering reduces clutter - Use Errors toggle (4) to hide successful transactions
- Text search narrows focus - Type in Filter box (4) to find specific device, register, or error type
- Copy for analysis - Click Copy All (3) to export, or Save (3d) for continuous file backup
- Clear between test runs - Click Clear (3c) to remove old entries
- Close to return to Monitor Points - Click Close (3e) or Show (1) again to return to Monitor Points
Understanding Log View Toggle
| Control | Location | Function | State Indicator |
|---|---|---|---|
| Show Button | Home tab → Log Group | Toggles between Monitor Points and Event Log views | Button stays pressed/highlighted when Log view is active |
| Quick Access | Can add to Quick Access Toolbar | One-click access without navigating to Home tab | Recommended for frequent troubleshooting |
View Behavior:
- Click Show: Monitor Points table → Event Log display (button stays pressed/highlighted)
- Click Show Again: Event Log → Monitor Points table (button released)
- Shared Portal: Both views occupy the same Window Portal Area
- Data Preserved: Switching views doesn't lose Monitor Points or Log data
Quick Access Recommendation
Right-click the Show button and add it to your Quick Access Toolbar for one-click switching during active troubleshooting sessions.
Complete Interface Overview
Visual relationship between all four labeled sections:
graph TB
    HOME["1 LOG GROUP<br/>(Home Tab)<br/>─────────<br/>Show Button"]

    CLICK1[" Click Show "]

    OPTIONS["2 OPTIONS TAB<br/>(Contextual Ribbon)<br/>─────────<br/>Contains 3 and 4"]

    subgraph GROUPS["Options Tab Contains:"]
        direction LR
        LOG["3 LOG GROUP<br/>Start/Stop<br/>Copy All<br/>Clear<br/>Save"]

        FILTER["4 FILTER GROUP<br/>Errors Toggle<br/>Text Filter"]
    end

    WINDOW["WINDOW PORTAL AREA<br/>─────────<br/>Log Entries Display<br/>(timestamped events)"]

    HOME -->|Click| CLICK1
    CLICK1 -->|Opens| OPTIONS
    OPTIONS -.->|Contains| LOG
    OPTIONS -.->|Contains| FILTER
    LOG -->|Controls| WINDOW
    FILTER -->|Filters| WINDOW

    CLICK2[" Click Show Again "]
    OPTIONS -->|Close| CLICK2
    CLICK2 -->|Returns to| MONITOR["Monitor Points Table"]

    style HOME fill:#e3f2fd,stroke:#1976d2,stroke-width:3px,color:#000
    style OPTIONS fill:#fff3e0,stroke:#f57c00,stroke-width:3px,color:#000
    style LOG fill:#c8e6c9,stroke:#388e3c,stroke-width:2px,color:#000
    style FILTER fill:#f3e5f5,stroke:#7b1fa2,stroke-width:2px,color:#000
    style WINDOW fill:#fff9c4,stroke:#f57f17,stroke-width:3px,color:#000
    style GROUPS fill:#f5f5f5,stroke:#666,stroke-width:2px
    style CLICK1 fill:#bbdefb,stroke:#1976d2,stroke-width:1px
    style CLICK2 fill:#ffccbc,stroke:#d84315,stroke-width:1px
    style MONITOR fill:#e8f5e9,stroke:#388e3c,stroke-width:2px
Key Relationships:
- Section 1 (Home Tab) triggers everything - click Show to begin
- Section 2 (Options Tab) appears automatically and contains sections 3 and 4
- Section 3 (Log Group in Options) provides recording control buttons
- Section 4 (Filter Group in Options) provides search and filter controls
- Both 3 and 4 affect what you see in the Window Portal Area (log entries display)
Practical Use Cases
Troubleshooting Connection Issues
Scenario: Device not responding
Steps: 1. Click Show → Event Log appears 2. Click Start in Options tab 3. Click Errors toggle to filter errors only 4. Type device name or address in Filter box 5. Attempt connection from Client tab 6. Review log entries for timeout/error messages 7. Click Copy All to send to support team
Benefits: Isolated error messages with exact timestamps
Monitoring Communication Health
Scenario: Verify stable polling operation
Steps: 1. Start logging before beginning poll cycle 2. Enable Save toggle for automatic file backup 3. Run polling for extended period (hours/days) 4. Periodically check Errors toggle to verify no issues 5. Review saved log file for patterns or intermittent errors
Benefits: Long-term reliability validation with automatic archival
Protocol Analysis for Custom Devices
Scenario: Reverse-engineering unknown device behavior
Steps: 1. Enable logging and Save toggle 2. Send test commands to device 3. Use Filter to search for specific function codes 4. Click Copy All → Paste into protocol analyzer 5. Compare request/response patterns
Benefits: Complete transaction history for protocol documentation
Best Practices
Logging Best Practices
Optimize Your Workflow:
- Save Before Logging: Enable the Save toggle before starting long monitoring sessions
- Filter Proactively: Use Errors toggle during troubleshooting to reduce noise
- Clear Regularly: Click Clear between test runs to avoid confusion
- Text Search: Use specific keywords (register address, function code, device name) for precise filtering
- Quick Access: Add Show and Clear to Quick Access Toolbar for rapid access
- Project Auto-Start: Saved projects remember logging state - automatically resumes if it was active
Performance Impact
Resource Considerations:
- Event logging consumes CPU cycles and memory to capture high-speed communication
- High poll rates (many registers per second) increase logging overhead significantly
- Disable logging when not actively troubleshooting for optimal performance
- Clear logs periodically during long sessions to free memory
- Text filtering searches all entries in real-time - may slow down with thousands of entries
Recommendation: Turn off logging during normal production operation unless you need historical records.
Data Persistence
What Gets Saved:
- With Save Toggle ON: Log file continuously updated in Documents folder
- With Save Toggle OFF: Logs exist only in memory, cleared when:
- You click Clear button
- You close XPF application
- You switch to another configuration file
File Location: Check your Windows Documents folder for auto-saved log files (typically named with timestamp).
Online Maps
Cloud-Based Modbus Maps - View and Download Online Modbus Maps from either (1) factory-released maps by Modbus Monitor or (2) community-uploaded maps from users. Toggle the Online button in the File group located in the Home tab to activate this feature. An internet connection is required to use this feature. For quick model lookup before download, open the Modbus Device Maps Start Page.
How to download pre-defined Modbus Map
Interface Components:
| # | Icon/Button | Function | Description |
|---|---|---|---|
| 1 | Online | Online Maps | Click the cloud button or Back button to toggle the Online Map navigator open or closed |
| 2a | X (Back) | Close navigator | Click the cloud button or Back button to toggle the Online Map navigator open or closed |
| 2b | Factory | Maps from Factory | Officially released and validated Modbus Maps |
| 2c | Community | Community Maps | View maps shared by others in the user community |
| 2d | Share | Upload | Upload your Modbus Map and share it with the online community |
| 2e | Download | Download | Download selected Online Maps to your local system |
| 2f | Status | Progress Indicator | Download or Upload status: Green Check mark: Operation completed successfully Red Cross: Error occurred. Download process was interrupted or there's an Internet connection issue. |
| 2g | Name | File display | Name of the map just downloaded or currently selected |
| 3 | Maps | Online Maps | List of Online Maps available by Manufacturer, Model, and Type. Use the search filter to quickly filter the list by Manufacturer or Model. |
Downloading Factory Maps:
- Click on the Factory Icon [1] and wait for the list to update from the cloud
- Click on the File Name from the list of available devices; the file name appears in the text area [6]
- Click on the Download button [4]
- The Modbus Map of the devices automatically opens when the file successfully downloads after the green check mark [5] appears and the online button closes
Factory Maps Advantage
Factory maps are officially validated and tested. They're your best starting point for common industrial equipment like VFDs, meters, and PLCs from major manufacturers.
Uploading Community Maps:
Users can upload their own custom Modbus Maps to share with the community or store them in the cloud repository for backup and easy access across multiple installations. This collaborative feature helps build a comprehensive library of device configurations.
YouTube Video on using Online Maps - Short demonstrations of features and workflows
Steps to Upload your Modbus Map:
- Click on Community icon [2c]
- Click on the Share Icon [2d] and choose the local XPF Modbus Map data file from your computer
- Green Check shows [2f] when the file is successfully uploaded to the cloud
- Click on the Community Files Maps icon [2c] to refresh the list of files in the window and see your contribution
Sharing Your Work
When to share your maps:
- You've created a map for equipment without factory support
- You've enhanced an existing map with additional registers
- You've documented a custom or proprietary device
- You want to help other users with the same equipment
Your contributions help the entire community!
4. Modbus Client Operations
Client Mode Overview: XPF operates as a Modbus Master (Client) when you want to read data from or write data to remote Modbus devices. In this mode, XPF initiates all communication by sending requests to Modbus Server devices (PLCs, drives, meters, sensors) and processes their responses. You can simultaneously connect to multiple devices using different interfaces and protocols.
Supported Interfaces & Protocols:
| Interface | Protocol Variants | Use Case |
|---|---|---|
| TCP | Modbus TCP, RTU over TCP, ASCII over TCP | Ethernet networks, most common for modern industrial systems |
| UDP | Modbus UDP, RTU over UDP, ASCII over UDP | Connectionless Ethernet, broadcasting applications |
| Serial | Modbus RTU, Modbus ASCII | Legacy systems, direct serial connections, RS485 networks |
Key Capabilities:
- Multi-Protocol Support - Connect TCP, UDP, and Serial devices simultaneously
- Continuous Polling - Automatic data collection from all configured monitor points
- Smart Write Operations - Automatic or manual function code selection for register writes
- Advanced Scanner - Discover unknown registers and build device maps automatically
- Real-Time Charting - Visualize data trends and patterns over time
- Auto Save & Restore - Automatic data logging and value restoration to devices
Client Tab Groups & Features
Complete reference for all Client tab ribbon groups and their functionality:
| Group | Purpose | Key Features | Description |
|---|---|---|---|
| Interface | Protocol Selection | Interface Type, Protocol Options, One-Based Toggle | Choose connection type (TCP/UDP/Serial) and Modbus protocol variant (Standard/RTU/ASCII) |
| TCP | Network Settings | IP Address, Port, Connection Timeout | Configure Ethernet-based connections with IP address, port number, and connection timeout settings |
| COM | Serial Settings | COM Port, Baud Rate, Data Bits, Parity, Stop Bits | Configure serial communication parameters for RTU/ASCII over RS232/RS485 connections |
| Timeout | Timing Control | Response Timeout, Inter-Frame Delay, Poll Rate, Retries | Critical timing parameters for reliable communication and performance optimization |
| Write | Write Operations | Auto/Manual Mode, Function Code Selection | Control how value changes are written to devices - automatic smart selection or manual function code control |
| Scanner | Address Discovery | Start Address, Register Count, Data Type, Swap Type, Unit ID | Systematically discover unknown registers and automatically build monitor point lists |
| Value | Data Management | Clear Values Toggle | Click: Immediately clears all values from display. Toggle ON: Automatically clears all monitor point values before starting each polling cycle for fresh data collection |
| Chart | Data Visualization | Chart Button | Switch to real-time charting view for trending analysis of tagged monitor points - see Charts - Data Trends Visualization for complete setup |
| Client Poll | Operation Control | Auto Save, Restore, Write, Read, Statistics, Start/Stop | Main operational controls for polling, data collection, and client status monitoring |
Detailed Group Breakdown
Primary connection and protocol configuration
| Control | Options | Function |
|---|---|---|
| Interface | TCP, UDP, Serial | Selects physical connection method |
| Protocol Options | Default, RTU, ASCII | Chooses Modbus protocol variant |
| One Based | Checkbox | Switches between 0-based and 1-based addressing |
Protocol Selection Guide: - TCP + Default = Standard Modbus TCP (most common) - TCP + RTU = Modbus RTU protocol over TCP/IP - TCP + ASCII = Modbus ASCII protocol over TCP/IP - Serial + Default/RTU = Standard Modbus RTU over serial - Serial + ASCII = Modbus ASCII over serial
Ethernet network connection settings
| Setting | Format | Range | Purpose |
|---|---|---|---|
| IP Address | IPv4/IPv6/Hostname | Any valid IP | Target device network address |
| Port | Integer | 1-65535 | TCP port (502 = standard Modbus) |
| Connection Timeout | Milliseconds | 0-65535 | Time to establish TCP connection |
Common Configurations:
Critical communication timing parameters
| Parameter | Range | Default | Impact |
|---|---|---|---|
| Response Timeout | 100-60000ms | 3000ms | How long to wait for device response |
| Inter-Frame Delay | 0-10000ms | 20ms | Delay between monitor point requests |
| Poll Rate | 100-3600000ms | 1000ms | Delay before repeating full scan |
| Retries | 1-65535 | 3 | Number of retry attempts for failed requests |
Automated register discovery and mapping
| Field | Purpose | Example |
|---|---|---|
| Start | Starting address | 400001 (first holding register) |
| Regs | Number to scan | 100 (scan 100 consecutive addresses) |
| Data | Assumed data type | UINT16, FLOAT32, INT32 |
| Swap | Byte order | ABCD_BE, CDBA_LE |
| ID | Target Unit ID | 1-247 |
Scanner Process: 1. Configure parameters above 2. Click "Start" to begin systematic polling 3. Valid responses automatically added to monitor points list 4. Invalid addresses skipped 5. Results appear in main monitor points list
Main operational controls for data collection
| Control | Function | Usage |
|---|---|---|
| Auto Save | CSV data logging | Automatically saves every scan to timestamped CSV files in My Documents folder |
| Restore | Upload values | Writes current monitor point values back to remote devices |
| Write | Single write | Writes selected monitor point value once |
| Read | Single poll | Polls all monitor points once and stops |
| Statistics | TX/RX counters | Shows communication statistics and frames per second Click to reset counters to 0 on next poll |
| Start/Stop | Master control | Begins/ends continuous polling operation |
Interface Configuration
The Client tab configures XPF as a Modbus Master device with comprehensive protocol support:
Choose from 3 TCP protocol variants:
| Protocol | Interface | Protocol Options | Use Case |
|---|---|---|---|
| Modbus TCP | TCP | Default | Standard Ethernet Modbus |
| Modbus RTU over TCP | TCP | RTU | Serial protocol over network |
| Modbus ASCII over TCP | TCP | ASCII | ASCII protocol over network |
TCP Configuration:
Choose from 3 UDP protocol variants:
| Protocol | Interface | Protocol Options | Use Case |
|---|---|---|---|
| Modbus UDP | UDP | Default | Standard UDP Modbus |
| Modbus RTU over UDP | UDP | RTU | Serial protocol over UDP |
| Modbus ASCII over UDP | UDP | ASCII | ASCII protocol over UDP |
UDP Configuration:
Choose from 2 serial protocol variants:
| Protocol | Interface | Protocol Options | Use Case |
|---|---|---|---|
| Modbus Serial RTU | Serial | Default or RTU | Binary serial protocol |
| Modbus Serial ASCII | Serial | ASCII | ASCII serial protocol |
Serial Configuration:
Timeout Settings
Critical timing parameters for reliable communication - these settings are crucial for optimizing communication efficiency:
| Parameter | Default | Range | Purpose & Impact |
|---|---|---|---|
| Response Timeout | 3000ms | 0-65535ms | Duration to gather all bytes from remote server including complete Modbus frame up to CRC. Too short = false timeouts, too long = slow error detection |
| Inter-Frame Delay | 20ms | 0-65535ms | Wait time between each monitor point in the list. Prevents overwhelming slow devices or networks |
| Poll Rate | 1000ms | 0-65535ms | Delay before scanning entire list again. Controls overall polling frequency. WARNING: Setting to 0 may cause UI slowdown/freezing as continuous polling impacts UI responsiveness. Recommended minimum: 20ms |
| Retries | 3 | 1-65535 | Number of retry attempts for failed requests. Higher values improve reliability on unreliable networks but increase error recovery time |
Timeout Optimization by Environment
Fast Local Networks (LAN):
Response Timeout: 1000ms    # Quick response expected
Inter-Frame Delay: 5ms      # Minimal delay needed
Poll Rate: 500ms           # Fast refresh rate
Slow Serial Connections:
Response Timeout: 5000ms    # Allow for slow serial transmission
Inter-Frame Delay: 50ms     # Prevent serial buffer overrun
Poll Rate: 2000ms          # Reduce load on serial device
WAN/Internet Connections:
Critical Timing Considerations
These parameters directly affect:
- Network traffic management - Higher delays = less network load
- Error detection speed - Longer timeouts = slower fault detection
- System responsiveness - Shorter poll rates = more responsive but higher load
- Device compatibility - Some devices need specific timing requirements
Write Operations
Control how XPF handles value changes in the Value column:
| Mode | Function | Behavior |
|---|---|---|
| Disabled | Read Only | Value changes revert on next scan |
| Auto | Smart Write | Automatically selects single/multiple write functions |
| Manual | Function Select | Choose specific Modbus write function codes |
Write Function Codes:
- Function 5 (0x05): Write Single Coil
- Function 6 (0x06): Write Single Register
- Function 15 (0x0F): Write Multiple Coils
- Function 16 (0x10): Write Multiple Registers
Scanner - Modbus Address Discovery Tool
Poll remote server to discover new Modbus Addresses or build Modbus Map for devices without public Modbus Maps. This is invaluable when Modbus Maps are unknown or unavailable from manufacturers.
Scanner Configuration Parameters:
| # | Field | Format | Description |
|---|---|---|---|
| 1 | Start | 6-digit format | Start Address to begin scanner (e.g., 400001 for holding registers) |
| 2 | Regs | Number | Number of registers or polls to serially scan consecutively |
| 3 | Data | Data Type | Assumed Data Type. The program automatically calculates the number of registers (1, 2, 4) to request depending on the Data Type selected |
| 4 | Swap | Swap Type | Data Swap for 32-bit or 64-bit data values (ABCD, CDBA, BADC, CDAB) |
| 5 | ID | Byte (1-247) | Server ID (Slave ID) to start scanning |
Scanner Process:
- Configure the range and parameters above
- Click "Start" to begin systematic polling of consecutive addresses
- Monitor results in real-time as scanner tests each address
- Valid responses are automatically added to monitor points list
- Invalid addresses are skipped (no response or error)
Typical Scanner Usage
Scenario: Unknown PLC registers
- Start: 400001 (Holding registers)
- Regs: 100 (scan 100 consecutive registers)
- Data: INT16 (assume 16-bit values)
- Swap: ABCD_BE (big-endian)
- ID: 1 (slave device 1)
Scanner will poll 400001 through 400100, adding responsive registers to your monitor points list automatically.
Charts - Data Trends Visualization
Modbus charting is essential for anyone working with industrial automation and control systems. With Modbus Monitor XPF, you can effortlessly visualize your Modbus data through time series, making it easier to analyze trends and patterns.
Why Use Charts?
- Visualize data values over time - See trends and patterns emerge
- Compare multiple signals - Track relationships between different registers
- Identify anomalies - Spot unusual behavior or drift
- Performance analysis - Evaluate system behavior under different conditions
- Quality control - Monitor process stability and consistency
Chart Setup & Configuration
Complete step-by-step process to enable and configure charting:
Step 1: Enable Chart for Monitor Points
Configure individual monitor points for charting:
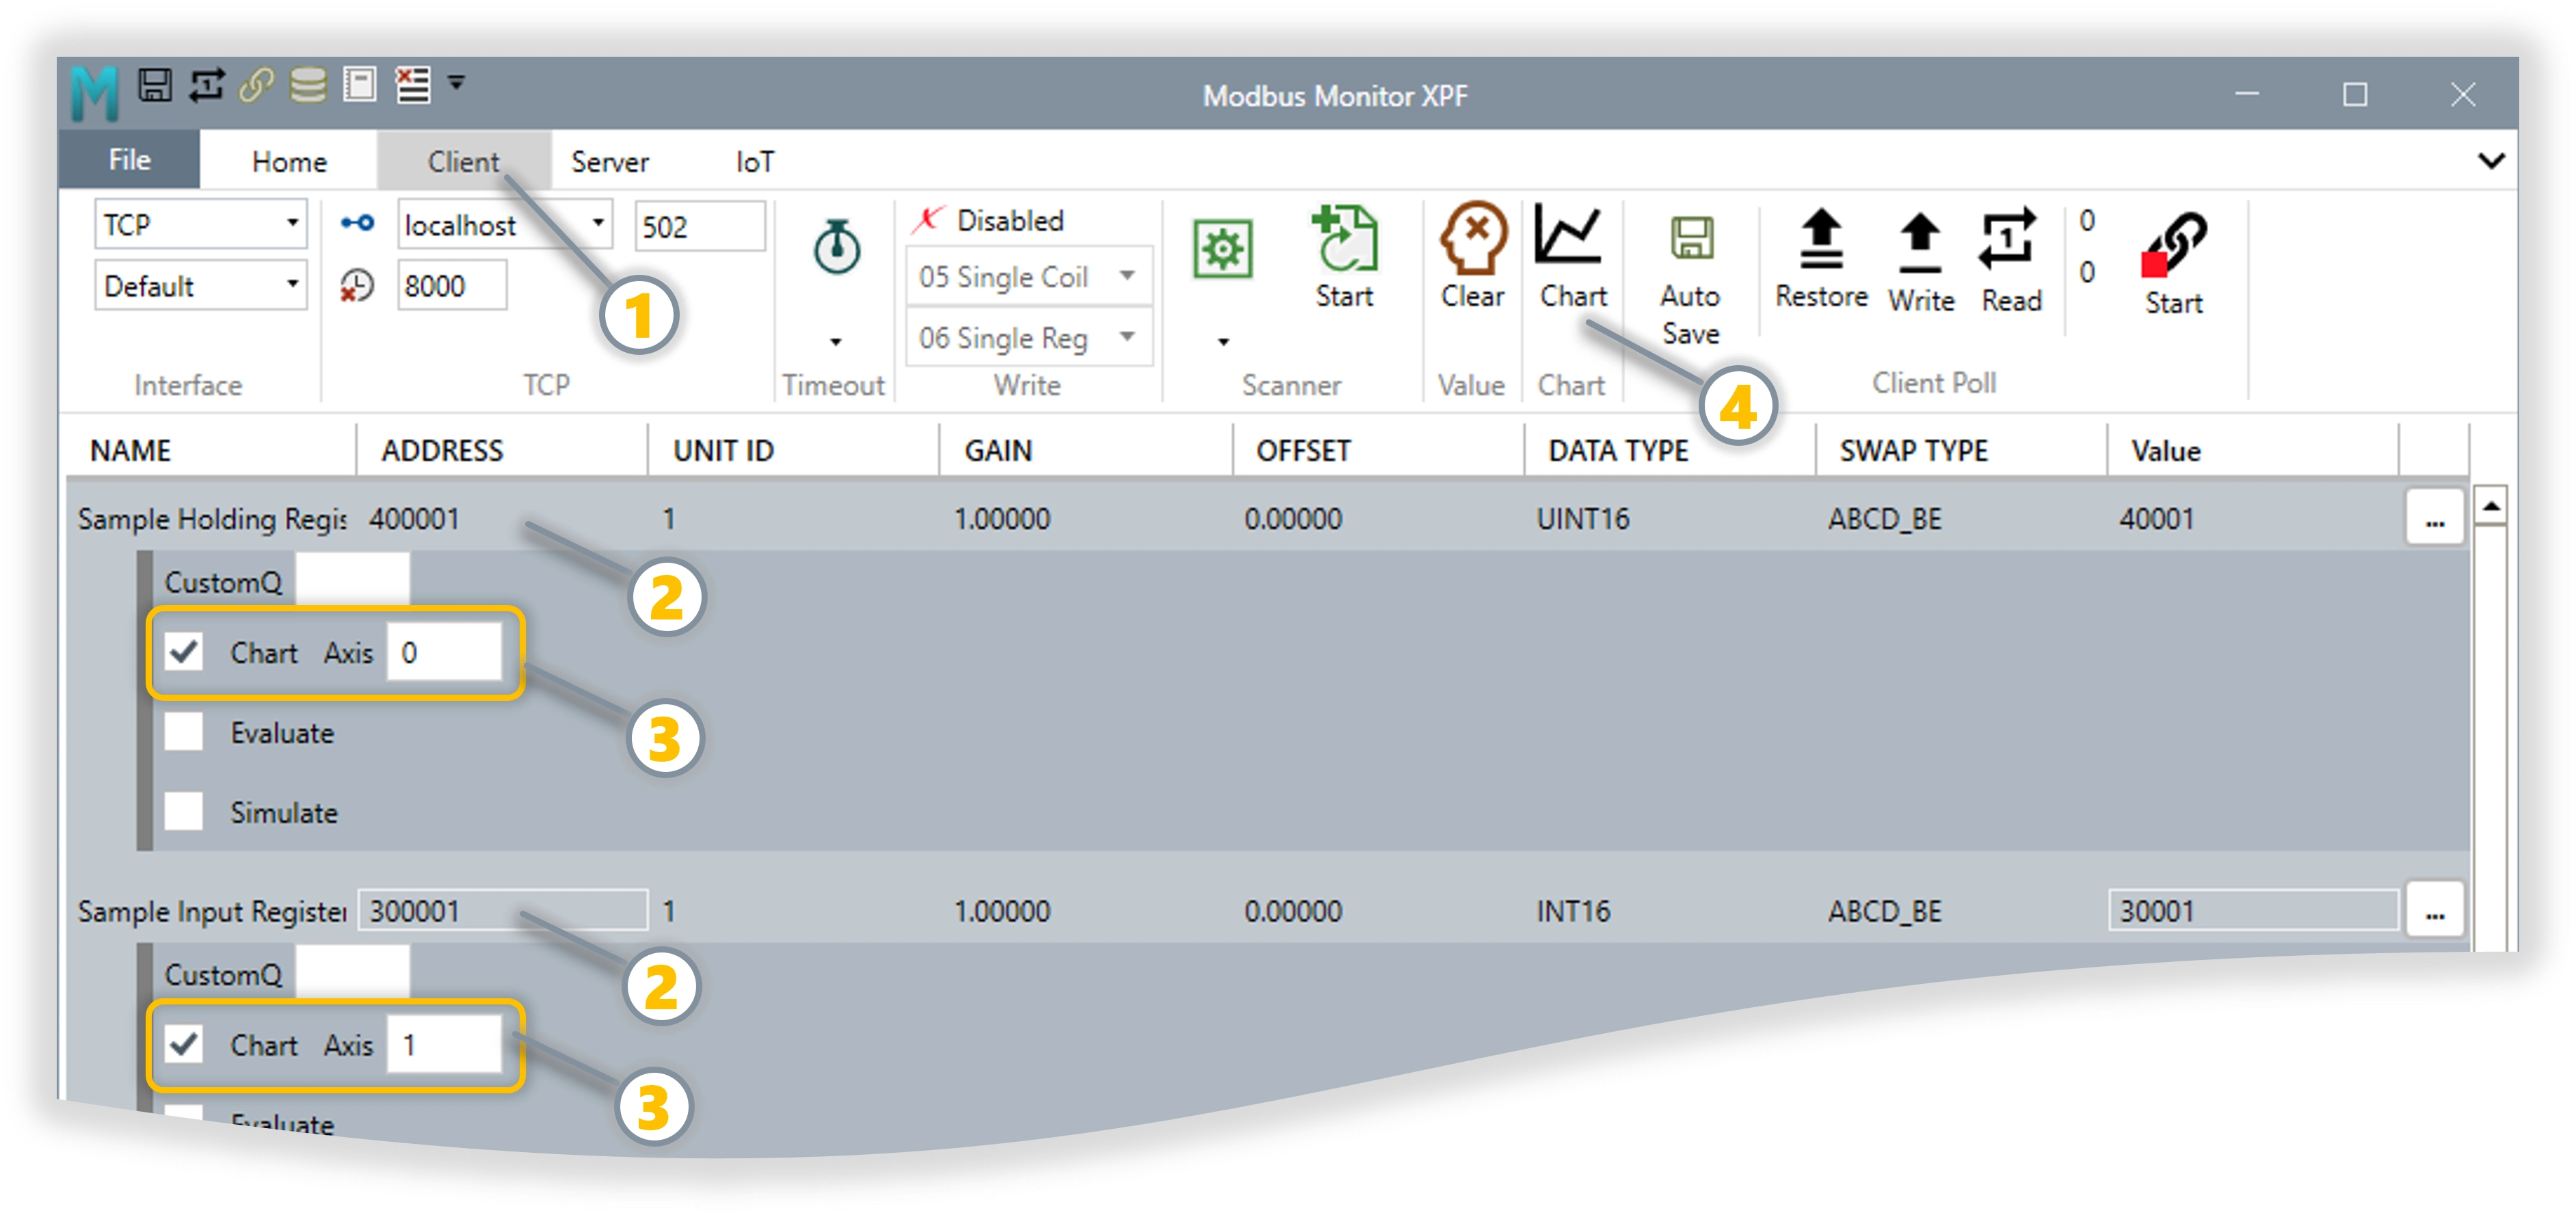 Monitor Point chart configuration options
-
Client:
- Click the Client Tab to find the Chart Group
-
Access Chart Settings:
- Click the three dots (...) button at the end of any monitor point row
- Extended options dialog opens
-
Enable Charting:
- Check the Chart checkbox to include this point in trending
- Unchecked: Monitor point excluded from chart (default)
- Checked: Values plotted on chart in real-time
- Select Chart Axis:
- Axis 0 (Left): Primary Y-axis scale (e.g., Temperature 0-100°C)
- Axis 1 (Right): Secondary Y-axis scale (e.g., Pressure 0-1000 PSI)
- Benefits: Compare values with different scales simultaneously
-
View Chart
- Click the Chart button in the Chart Group on the Client tab to view the floating chart window
- For detailed chart controls, see Chart Controls & Options below
-
Optimize Performance
- Configure timeout settings in the Client tab to minimize delays between polls
- Nyquist Rate: Poll rate should be at least 2x faster than the fastest expected data changes for smooth graphs
- See Timeout Settings for optimization guidelines
Step 2: Start Data Collection
Begin polling to collect chart data:
Refer to Modbus Client Operations on locations of Client controls.
-
Configure Client Connection:
- Set up TCP, UDP, or Serial connection in Client tab
- Configure proper IP address, COM port, and communication parameters
- Verify timeout settings for reliable data collection
-
Start Continuous Polling:
- Click Start button in Client Poll group
- Polling must be active for chart data collection
- Monitor points with Chart enabled begin data accumulation
-
Verify Data Collection:
- Check TX/RX counters show active communication
- Monitor point values should update in real-time
- Any communication errors will affect chart data quality
Step 3: Access Chart View
Switch to chart display and configure visualization:
Open Chart Window: - Click Chart button in Client tab → Chart group - Chart pops out as floting winow - All chart-enabled points appear as trending lines
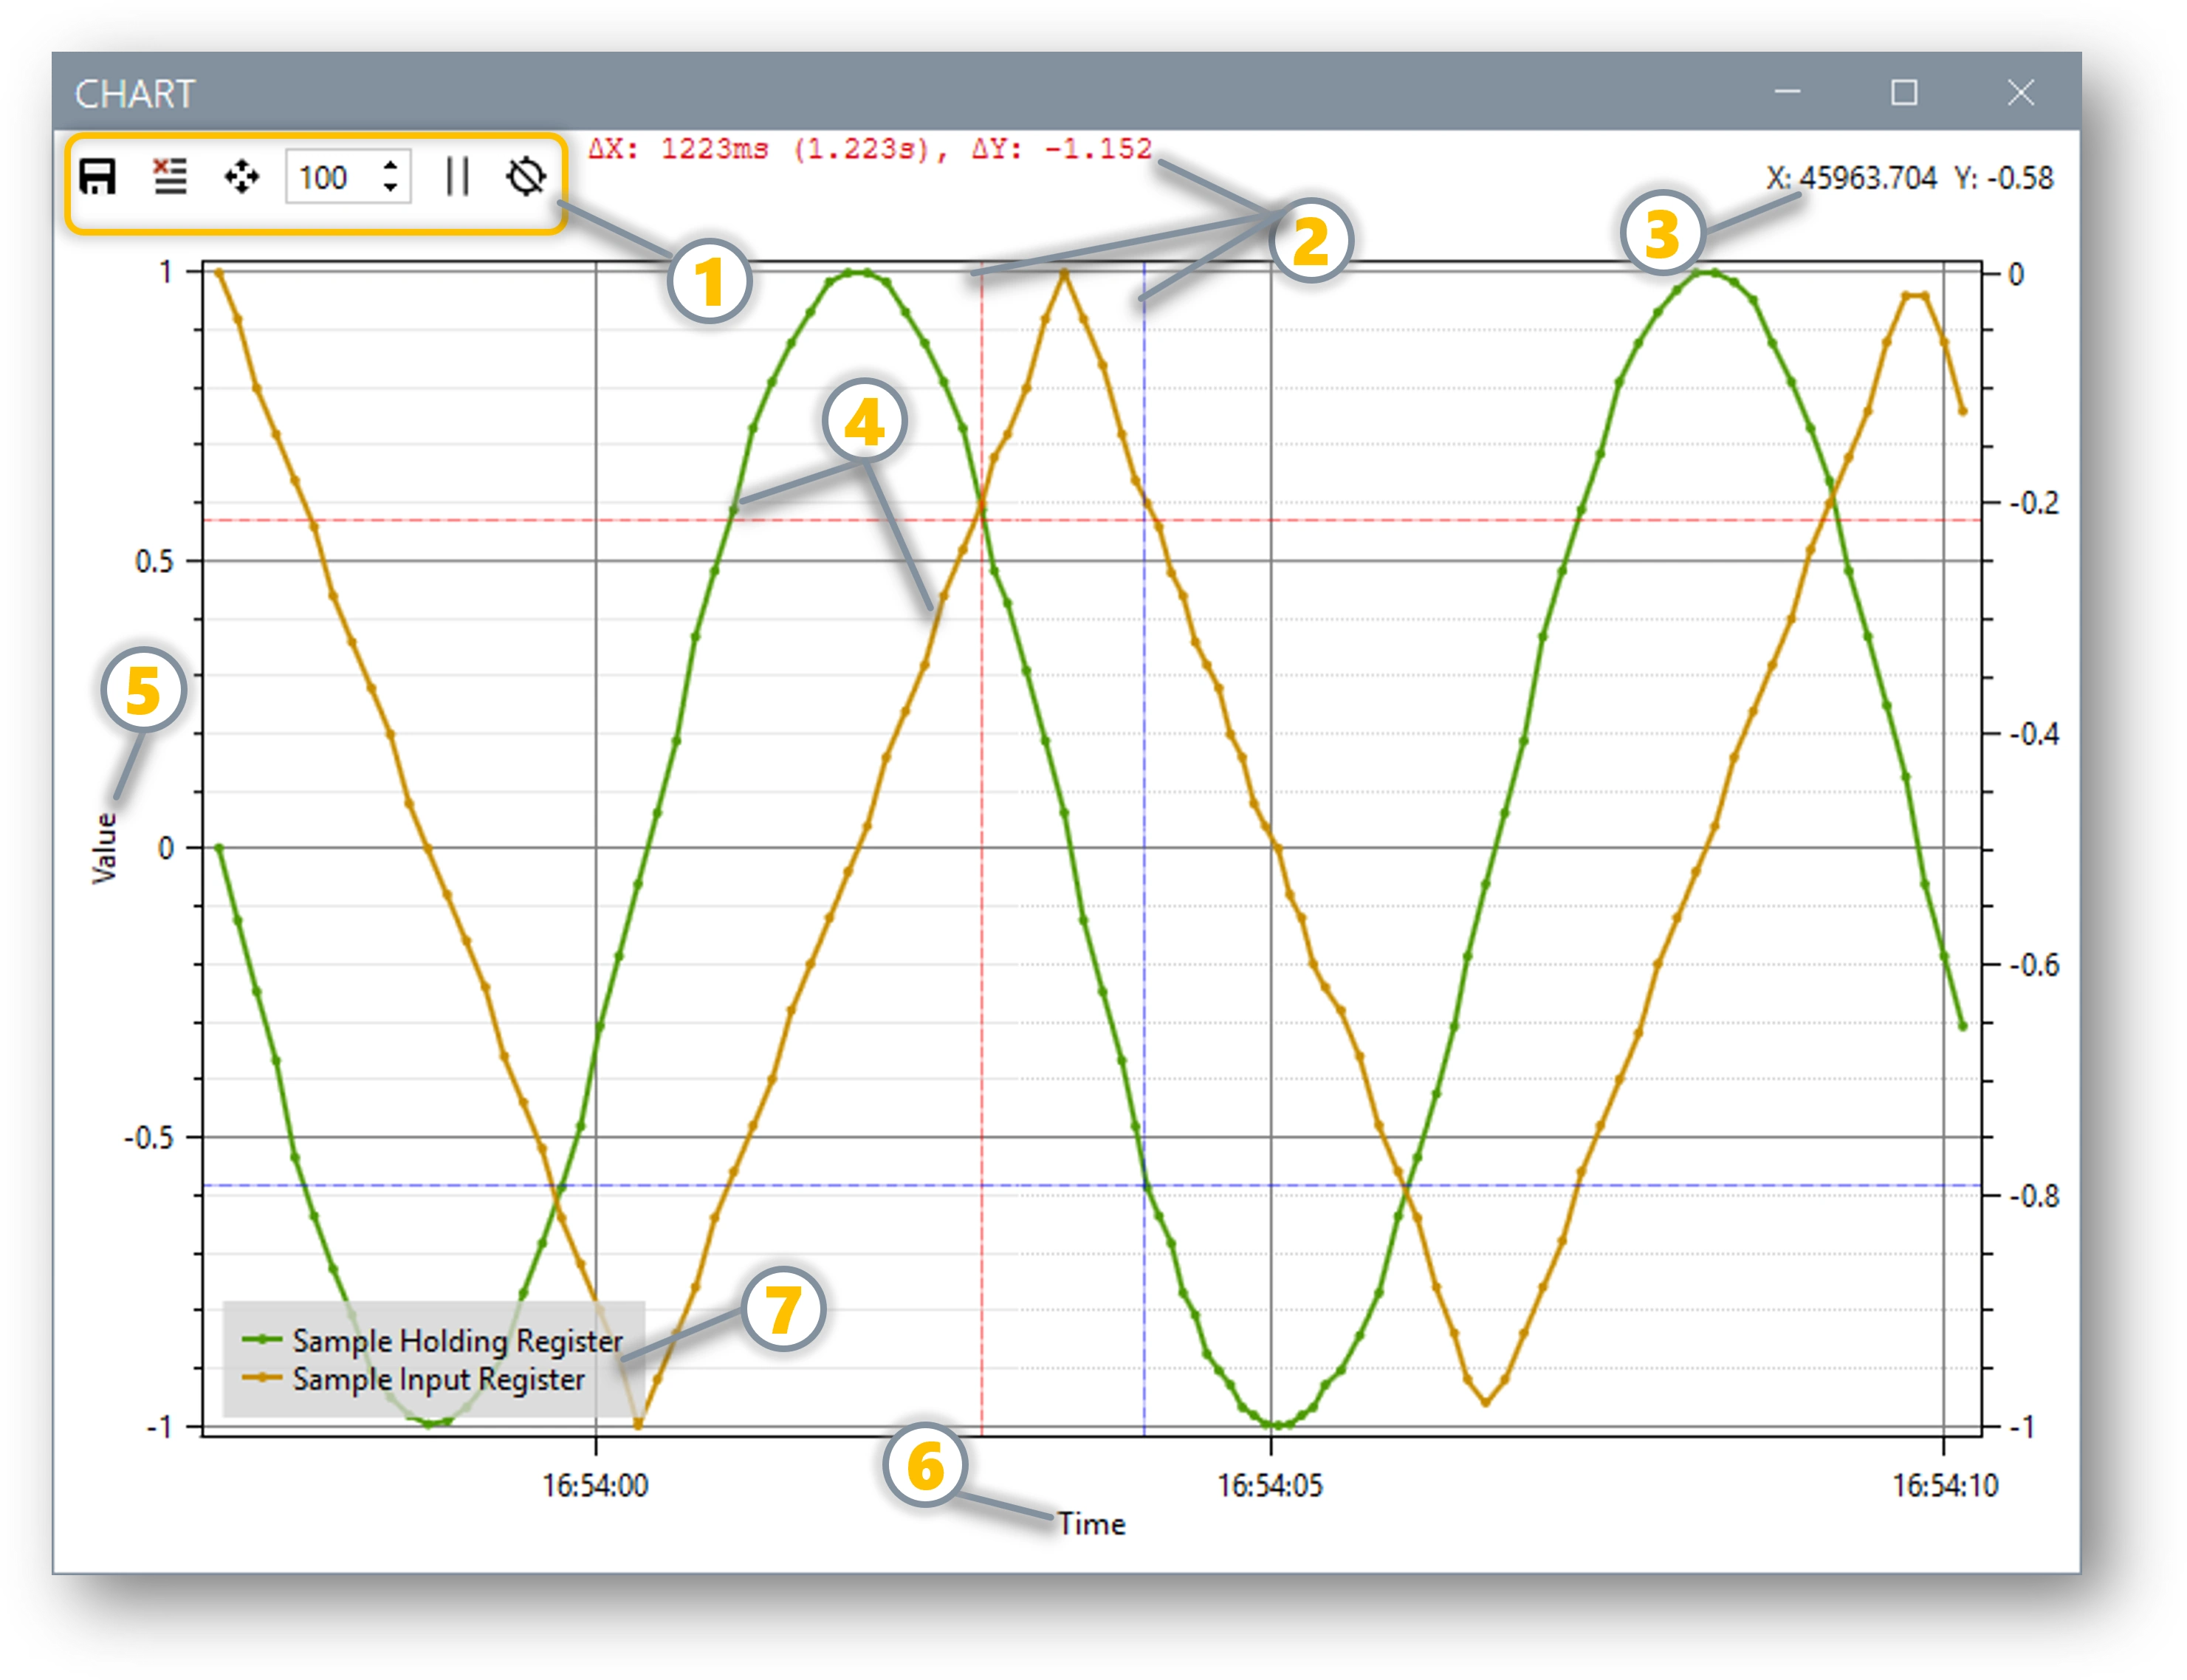 Complete chart window showing dual-axis trending
Step 4: Chart Controls & Options
Complete Chart Interface Reference:
Main Chart Interface Components:
| Label | Component | Location | Function | Details |
|---|---|---|---|---|
| 1 | Control Toolbar | Top horizontal bar | Chart operation controls | Contains all chart control buttons (1a-1g) detailed in Control Toolbar Breakdown below |
| 2 | Chart Plot Area | Main display | Time-series visualization Delta Measurement |
Multi-colored trend lines with dual Y-axes support Multiple crosshair sets as overlay |
| 3 | Location Info | Right Top | Selection Info | Show XY value of selection inside Plot Area |
| 4 | Trend Lines | Within plot area | Data visualization | Color-coded lines representing each monitor point's values over time |
| 5 | Left Y-Axis | Left vertical edge | Primary scale (Axis 0) |
Default axis for most monitor points (e.g., Temperature, Flow, Level, Percentage) |
| 6 | Right Y-Axis | Right vertical edge | Secondary scale (Axis 1) |
Alternative axis for different value ranges (e.g., Pressure, Current, Power, Voltage) |
| 7 | Legend Area | Right side panel | Series identification | Shows monitor point names, colors, and current values for each trend line |
Chart Interactive Features & Measurements:
| Feature | Mouse Action | Visual Result | Data Display | Usage |
|---|---|---|---|---|
| Crosshair Placement | Left Click on Chart Plot (Label 2) | Vertical & horizontal lines appear as overlay | Exact X,Y coordinates in display area (1g) | Precise value measurement at specific time points |
| Delta Measurement | Multiple Crosshair Clicks | Multiple crosshair sets as overlay | Coordinate differences between points (1g) | Calculate change rates, time intervals, and value differences |
| Axis 0 Data Reading | Click on Left Y-Axis area (Label 3) | Crosshair shows Axis 0 scale | Temperature, Flow, Level readings | Monitor primary process variables |
| Axis 1 Data Reading | Click on Right Y-Axis area (Label 4) | Crosshair shows Axis 1 scale | Pressure, Current, Power readings | Monitor secondary scale variables |
| Time Point Selection | Click on X-Axis area (Label 5) | Vertical crosshair line | Timestamp and all values at that time | Analyze specific time moments |
| Trend Line Analysis | Click near Trend Lines (Label 6) | Highlight selected trend | Individual monitor point value | Focus on specific data series |
| Legend Interaction | Click on Legend Area (Label 7) | Highlight/hide trend lines | Monitor point details | Show/hide specific data series |
| Pan Navigation | Right-click Mouse Drag on Chart Plot | Scroll through historical data | Updated time range display | Review past trends when buffer is limited |
| Zoom Control | Mouse Wheel on Chart Plot | Zoom in/out on time axis | Focused time period view | Examine specific time intervals in detail |
Control Toolbar Breakdown (Reference Label 1 from interface above):
The control toolbar contains all chart operation controls. Each button provides specific functionality:
| Label | Control | Function | Description |
|---|---|---|---|
| 1a | Save Toggle | Auto CSV Export | Toggle ON: Automatically saves chart data to CSV files in Documents folder during data collection Toggle OFF: No automatic saving (manual export only) File Location: Documents\ChartData_YYYY-MM-DD_HH-MM-SS.csv |
| 1b | Clear | Reset Chart Buffer | Immediately clears all chart data from memory and display Warning: Cannot be undone - save important data first Effect: Chart starts fresh with next data points |
| 1c | Fit | Auto-Scale Axes | Automatically adjusts both Y-axis ranges to fit all visible data Smart Scaling: Considers both Axis 0 (left) and Axis 1 (right) simultaneously Usage: Click after data collection or when chart appears off-screen |
| 1d | Samples | Buffer Size Control | Value = 0: Unlimited buffer (all data retained, chart doesn't pan) Value > 0: Rolling window buffer (chart pans left as new data arrives) Range: 0 to 999,999 samples Memory Impact: Larger buffers use more RAM |
| 1e | Start/Pause | Chart Update Control | Started State: Chart updates in real-time with incoming data Paused State: Chart display frozen (data collection continues in background) Button Text: Shows "Started" or "Paused" dynamically Visual: Play icon when paused, Pause icon when running |
| 1f | Clear Crosshairs | Remove Measurement Lines | Removes crosshair lines and coordinate display from chart Reset Function: Clears all placed crosshairs and delta measurements Delta Reset: Removes coordinate difference calculations |
| 1g | Coordinate Display | Live Position Feedback | Live Coordinates: Shows X,Y values under mouse cursor Crosshair Coordinates: Displays exact X,Y when crosshairs are active Delta Calculations: Shows differences between multiple crosshair points Format: X: 123.456 Y: 78.90 |
Dual-Axis Coordinate System:
| Axis | Label | Location | Scale Purpose | Coordinate Display | Monitor Point Assignment |
|---|---|---|---|---|---|
| Axis 0 | Label 3 | Left Y-Axis | Primary scale | Left side values in crosshair display | Default axis - Temperature, Flow, Level, Percentage |
| Axis 1 | Label 4 | Right Y-Axis | Secondary scale | Right side values in crosshair display | Alternative scale - Pressure, Current, Power, Voltage |
| X-Axis | Label 5 | Bottom | Time progression | Time values in crosshair display | Universal time axis for all monitor points |
Advanced Control Functions:
Chart Control Best Practices
Optimize chart performance for different scenarios:
Real-Time Monitoring (≤100ms poll rate): - Save Toggle: ON (auto-save for audit trail) - Samples: 1000-5000 (manageable buffer size) - Start/Pause: Started (continuous updates) - Crosshairs: Use for spot measurements
Data Analysis (1-10 second poll rate): - Save Toggle: ON (capture complete dataset) - Samples: 0 (unlimited for complete history) - Start/Pause: Paused (freeze for analysis) - Fit: Use frequently to optimize view
Performance Testing (High-speed capture): - Save Toggle: ON (document test results) - Samples: 10000+ (capture complete test) - Clear: Reset between test runs - Crosshairs: Mark critical events
Sample Buffer Configuration:
| Setting | Behavior | Use Case |
|---|---|---|
| 0 (Unlimited) | All data stored, chart doesn't pan | Short tests, complete data retention |
| 100-1000 | Rolling window, chart pans left | Medium-term monitoring, memory management |
| 5000+ | Large rolling buffer | Long-term trending, high-frequency data |
Memory Considerations
Buffer Size Impact:
- Unlimited (0): Uses increasing memory over time - suitable for tests under 1 hour
- Limited buffer: Fixed memory usage - required for continuous 24/7 monitoring
- High poll rates: Consider smaller buffers to prevent memory exhaustion
- Multiple axes: Memory usage increases with number of chart-enabled points
Advanced Chart Features
Dual-Axis Configuration
Optimize multi-signal visualization with different scales:
When to Use Dual Axes:
- Different Value Ranges: Temperature (0-100°C) vs Pressure (0-3000 PSI)
- Different Units: Speed (RPM) vs Current (Amps) vs Temperature (°C)
- Correlation Analysis: Compare process variables with different scales
Configuration Strategy:
Axis 0 (Left) - Process Variables:
  - Temperature: 0-150°C
  - Flow Rate: 0-500 GPM
  - Level: 0-100%

Axis 1 (Right) - Electrical Variables:
  - Motor Current: 0-50 Amps
  - Power: 0-100 kW
  - Frequency: 0-60 Hz
Real-Time Performance Optimization
Optimize chart performance for different monitoring scenarios:
| Scenario | Poll Rate | Buffer Size | Axis Strategy | Best Practices |
|---|---|---|---|---|
| Quick Test | 100-500ms | 0 (unlimited) | Single axis | Save data before clearing |
| Process Monitoring | 1-5 seconds | 1000-5000 | Dual axis | Enable Auto Save |
| Long-term Trending | 30-60 seconds | 10000+ | Dual axis | Regular CSV export |
| High-speed Capture | 50-100ms | 500-1000 | Single axis | Limited duration |
Chart Data Export & Analysis
CSV Export Format
Chart data export structure for external analysis:
Export Process:
- Initiate Export:
- Click Save button in chart controls
- File save dialog opens
-
Default location: Windows Documents folder
-
CSV File Structure:
-
Analysis Applications:
- Excel: Statistical analysis, additional charting
- MATLAB: Advanced signal processing, FFT analysis
- Python/R: Custom analytics, machine learning
- Process historians: Long-term data storage
Integration with Auto Save
Combine charting with automatic data logging:
Complete Data Capture Strategy
For comprehensive data collection:
- Enable Auto Save: Captures ALL monitor points every poll cycle
- Enable Charts: Visual real-time trends for selected points
- Export Charts: Detailed time-series data for specific analysis
- Result: Complete audit trail + focused trending analysis
Common Chart Use Cases
Process Control Applications
Industrial process monitoring and optimization:
Temperature Control Loop
Scenario: Monitor PID temperature controller performance
Chart Configuration:
Axis 0 (Temperature):
  - Setpoint: 85.0°C (400001)
  - Process Variable: 84.7°C (400002)
  - Output: 67.5% (400003)

Axis 1 (Status):
  - Alarm Status: False (100001)
  - Manual Mode: False (100002)
Benefits:
- Visualize setpoint tracking performance
- Monitor controller output response
- Identify oscillations or instability
- Correlate alarms with process conditions
Equipment Commissioning
Validate new equipment performance:
Motor Drive Startup
Scenario: Commission variable frequency drive
Chart Setup:
Axis 0 (Mechanical):
  - Speed Command: 1750 RPM (400010)
  - Actual Speed: 1748 RPM (400011)
  - Torque: 78.3% (400012)

Axis 1 (Electrical):
  - Motor Current: 12.4 Amps (400020)
  - DC Bus Voltage: 485 VDC (400021)
  - Power: 8.7 kW (400022)
Analysis Goals: - Verify speed tracking accuracy - Check acceleration/deceleration rates - Monitor current during load changes - Document performance baselines
Quality Control Testing
Automated pass/fail validation with visualization:
Batch Process Validation
Scenario: Monitor batch reactor parameters
Combined Tools:
- Charts: Real-time trending of critical parameters
- Evaluate Limits: Automatic pass/fail validation
- Auto Save: Complete batch record for compliance
Implementation: 1. Set High/Low limits on all critical parameters 2. Enable charting for visual confirmation 3. Enable Auto Save for audit trail 4. Monitor color-coded limit violations in real-time
Troubleshooting Chart Issues
Common Problems & Solutions
| Problem | Symptoms | Solution |
|---|---|---|
| No data appearing | Empty chart, no lines | Verify polling is active, check monitor point Chart checkbox |
| Chart not updating | Frozen display | Check Client connection, verify communication success |
| Memory issues | Slow performance, crashes | Reduce buffer size, limit number of chart points |
| Wrong scaling | Data off-screen | Click Fit button, check axis assignments |
| Export failure | CSV save errors | Check disk space, verify Documents folder access |
Performance Optimization
Maximize chart performance for your application:
Chart Performance Best Practices
Optimize for your monitoring needs:
High-Speed Monitoring (≤100ms poll rate): - Save Toggle: ON (auto-save for audit trail) - Samples: 1000-5000 (manageable buffer size) - Start/Pause: Started (continuous updates) - Crosshairs: Use for spot measurements
Process Monitoring (1-10 second poll rate): - Save Toggle: ON (capture complete dataset) - Samples: 0 (unlimited for complete history) - Start/Pause: Paused (freeze for analysis) - Fit: Use frequently to optimize view
Long-term Trending (≥30 second poll rate): - Save Toggle: ON (auto-save for audit trail) - Samples: 0 (unlimited for complete history) - Start/Pause: Paused (freeze for analysis) - Fit: Use frequently to optimize view
High-speed Capture (50-100ms poll rate): - Save Toggle: ON (document test results) - Samples: 10000+ (capture complete test) - Clear: Reset between test runs - Crosshairs: Mark critical events
Memory Usage Calculation
Estimate memory requirements:
Memory Usage = Points × Buffer Size × 8 bytes

Example: 10 points × 1000 samples × 8 bytes = 80 KB
Large Setup: 50 points × 10000 samples × 8 bytes = 4 MB
Guidelines: Keep total chart memory under 50 MB for optimal performance.
Auto Save
Auto Save is XPF's comprehensive data logging solution that eliminates the risk of data loss while providing continuous audit trails for industrial monitoring applications. This essential feature transforms XPF from a monitoring tool into a complete data historian, automatically capturing every polling cycle for analysis, compliance, and troubleshooting.
Why Auto Save is Critical for Industrial Applications:
Auto Save addresses a fundamental requirement in industrial automation: continuous data retention without manual intervention. Whether you're monitoring process variables, validating equipment performance, or maintaining compliance records, Auto Save ensures no data is ever lost.
Automatically saves every scan to CSV files - essential for data logging and analysis:
Comprehensive Data Logging Capabilities:
- Every polling cycle captured - No data gaps or missed readings
- Automatic CSV file creation - Files generated in Documents folder with timestamps
- Intelligent file management - New files created automatically to prevent oversized files
- Complete data capture - All monitor points included in every save operation
- Real-time logging - Data written immediately upon collection
- Timestamped records - Precise time correlation for all data points
Revolutionary Benefits for Data Management:
Data Security & Compliance
Traditional Risk: Manual data collection leads to gaps and human error
Auto Save Solution: 100% automated capture with zero intervention required
Result: Complete audit trail + guaranteed data retention
Industrial Applications & Benefits:
- Zero Manual Intervention - Set it and forget it operation eliminates human error
- Compliance Documentation - Automatic record keeping for regulatory requirements
- Continuous Monitoring - Never lose critical readings during overnight or weekend operations
- Post-Analysis Ready - CSV format compatible with Excel, MATLAB, Python, R, and all analysis tools
- Production Environment Safe - Background logging doesn't interfere with real-time monitoring
- Chart Analysis Integration - Seamless data export for trending and visualization
- Troubleshooting Support - Historical data available for root cause analysis
- Performance Validation - Long-term data collection for equipment performance assessment
Complete Auto Save Workflow:
Data Logging Implementation
Step 1: Enable Auto Save
- Configure Monitor Points: Set up all data points you want to log continuously
- Enable Auto Save: Click Auto Save button in Client Poll group (button stays pressed/highlighted)
- Start Polling: Click Start button to begin continuous data collection
- Verify Logging: Check Documents folder for automatically created CSV files
Step 2: File Management & Organization
- File Location:
Documents\ModbusScan_YYYY-MM-DD_HH-MM-SS.csv - Automatic Naming: Timestamp-based filenames prevent overwrites
- File Rotation: New files created periodically to maintain manageable file sizes
- Data Integrity: Each file contains complete timestamp and value data
Step 3: Data Analysis & Usage
- Excel Import: Direct CSV import for trending and analysis
- MATLAB Processing: Load CSV data for advanced signal processing
- Database Import: Bulk import historical data into SQL databases
- Compliance Reports: Generate regulatory reports from logged data
File Structure & Format:
| Column | Content | Example | Purpose |
|---|---|---|---|
| Timestamp | Date/Time | 2025-11-05 14:30:15 |
Precise data collection time |
| Monitor Point 1 | Value | 25.4 |
First configured monitor point value |
| Monitor Point 2 | Value | 1847 |
Second configured monitor point value |
| Monitor Point N | Value | TRUE |
Additional points as configured |
Usage Examples:
Documents/ModbusScan_2025-11-05_14-30-15.csv
Documents/ModbusScan_2025-11-05_14-31-15.csv
Documents/ModbusScan_2025-11-05_14-32-15.csv
Advanced Data Management:
| Use Case | Strategy | Benefits |
|---|---|---|
| Long-term Monitoring | Enable Auto Save for continuous operation | Complete historical record |
| Process Validation | Combine with Chart analysis | Visual + numerical data |
| Compliance Audits | Automatic timestamped records | Regulatory requirement satisfaction |
| Troubleshooting | Historical data correlation | Root cause analysis capability |
Why Auto Save is Superior to Manual Logging:
- Reliability: Never miss data due to human oversight or system interruption
- Accuracy: Eliminates transcription errors from manual data recording
- Efficiency: No staff time required for data collection activities
- Completeness: Captures every poll cycle, not just periodic samples
- Compliance: Provides auditable trail with precise timestamps
- Scalability: Handles hundreds of monitor points as easily as one
Restore
Restore is XPF's most powerful device configuration tool - the only comprehensive solution available for writing complete device configurations from saved monitor point values directly into remote Modbus devices. This revolutionary capability transforms device commissioning from hours of manual work to minutes of automated configuration.
Why Restore is Essential for Device Configuration:
Restore solves a critical industrial automation challenge: efficiently configuring new devices with known parameter sets. Instead of manually entering hundreds of parameters through device interfaces, XPF writes your entire configuration in one operation.
Write monitoring data directly into remote Modbus devices - excellent for production setup and device commissioning:
Unique Capabilities - The Only Tool of Its Kind:
- Complete Configuration Restoration - Write entire device parameter sets from saved XPF project files
- Mass Device Programming - Configure multiple identical devices with the same parameter set
- Configuration File Management - Save and reuse device configurations as XPF project files
- Validation & Verification - Write known values and immediately read back for configuration verification
- Batch Parameter Upload - Set hundreds of parameters simultaneously in one operation
- Quality Assurance Tool - Ensure all devices match approved configuration standards
- Zero Manual Entry - Eliminate human error from manual parameter entry through device interfaces
Revolutionary Benefits for Device Configuration:
Configuration Time Savings
Traditional Method: 2-4 hours per device manually entering parameters
XPF Restore Method: 2-5 minutes automated parameter upload
Result: 95% time reduction + 100% accuracy guarantee
Industrial Use Cases & Applications:
- Manufacturing Setup: Program new devices with factory-approved configurations stored as XPF files
- Commissioning Projects: Deploy pre-tested configurations to multiple field devices instantly
- Replacement Devices: Restore failed devices to exact original configurations from backup files
- Standardization: Ensure all devices of the same type use identical parameter sets across facilities
- Testing & Development: Validate device behavior with known input configurations
- Maintenance Operations: Restore devices to known-good configurations after service
- Calibration Procedures: Set precise reference values for sensor and instrument calibration
- Quality Control: Verify new devices match specifications before installation
Configuration File Management Strategy:
Best Practices for Configuration Files
Save Master Configurations:
- Golden Standard Files: Save XPF projects with verified, approved device configurations
- Version Control: Maintain different configuration versions for different applications
- Backup & Recovery: Store configuration files for quick device replacement
- Documentation: XPF project files serve as complete parameter documentation
- Team Sharing: Distribute standard configurations across engineering teams
Complete Restore Workflow:
Device Configuration Workflow
Step 1: Create Master Configuration
- Configure Reference Device: Set up one device manually with all desired parameters
- Read Configuration: Use XPF Client to read all parameters from configured device
- Save Master File: Save XPF project as master configuration file (e.g., "VFD_StandardConfig.xpf")
- Verify Configuration: Test master file by restoring to another device and validating
Step 2: Deploy to New Devices
- Open Master File: Load your saved master configuration XPF project
- Connect to New Device: Configure XPF Client connection to target device
- Execute Restore: Click Restore button in Client Poll group
- Verify Success: Read back parameters to confirm successful configuration
Step 3: Maintain Configuration Library
- Organize Files: Create folders by device type, application, or project
- Document Versions: Use clear naming conventions (DeviceType_Application_v1.0.xpf)
- Regular Backups: Store configuration files in version control systems
- Update Management: Maintain current configurations as devices evolve
Advanced Configuration Management:
| Scenario | Configuration Strategy | Benefits |
|---|---|---|
| Multiple Device Types | Separate XPF files per device model | Type-specific parameter sets |
| Different Applications | Application-specific configuration variants | Optimized for specific processes |
| Site Standardization | Master configurations per facility | Consistent equipment across sites |
| Revision Control | Versioned configuration files | Track parameter changes over time |
Why Restore is Superior to Manual Configuration:
- Speed: Restore 200+ parameters in under 5 minutes vs. hours of manual entry
- Accuracy: Zero transcription errors vs. inevitable human mistakes
- Repeatability: Identical configuration every time vs. manual variations
- Documentation: Configuration automatically documented in XPF project files
- Validation: Built-in verification through read-back capability
- Scalability: Configure dozens of devices with same effort as one device
Client Poll - Controls
| Control | Function | Usage |
|---|---|---|
| Auto Save | CSV data logging | Automatically saves every scan to timestamped CSV files in My Documents folder |
| Restore | Upload values | Writes current monitor point values back to remote devices |
| Write | Single write | Writes selected monitor point value once |
| Read | Single poll | Polls all monitor points once and stops |
| Statistics | TX/RX counters | Shows communication statistics and frames per second Click to reset counters to 0 on next poll |
| Start/Stop | Master control | Begins/ends continuous polling operation |
5. Modbus Server Operations
Server Mode Overview: XPF operates as a Modbus Server (Slave) when you want to simulate Modbus devices or provide data to Modbus Client applications. In this mode, XPF responds to requests from Modbus Master devices (SCADA systems, HMIs, PLCs) by serving data from your configured monitor points. This is invaluable for development, testing, and device simulation without requiring physical hardware.
Supported Server Interfaces & Protocols:
| Interface | Protocol Variants | Use Case |
|---|---|---|
| TCP | Modbus TCP, RTU over TCP, ASCII over TCP | Standard Ethernet Modbus servers, most common for modern applications |
| UDP | Modbus UDP, RTU over UDP, ASCII over UDP | Connectionless servers, broadcasting, specialized applications |
| Serial | Modbus RTU, Modbus ASCII | Legacy system simulation, RS485 network simulation, direct serial connections |
Key Server Capabilities:
- Multi-Interface Concurrent Operation - Run TCP and multiple Serial servers simultaneously
- Traffic Capture & Learning - Automatically build Modbus maps from incoming client requests
- Advanced Simulation Engine - Generate dynamic test data with sine waves, ramps, and patterns
- Real Device Simulation - Millisecond response times for realistic device behavior
- Multi-Protocol Support - Six protocol combinations (TCP/UDP × Default/RTU/ASCII)
- Multiple Instance Support - Run multiple server instances on different ports/interfaces
Why Use Server Mode?
- SCADA Development: Simulate Modbus devices for development without physical hardware
- Learning: Understand Modbus Protocol through hands-on experimentation
- Testing: Validate client implementations against known-good server responses
- Device Simulation: Replace expensive equipment during development and testing
- Production Setup: Configure and test systems before hardware installation
- Protocol Analysis: Capture and analyze Modbus communication patterns
- Training: Provide safe learning environment for Modbus communication
Server Tab Groups & Features
Complete reference for all Server tab ribbon groups - expert-level technical capabilities:
| Group | Key Technical Options | Advanced Capabilities | Details |
|---|---|---|---|
| TCP | Interface: TCP/UDP Port: 502 (configurable) Protocol: Default/RTU/ASCII |
Six protocol combinations • IPv4/IPv6/Both/Loopback binding • Concurrent TCP OR UDP (not both) | TCP Details ↓ |
| Serial | Ports: Multiple simultaneous Rates: 300-921600 bps Protocol: RTU/ASCII |
Independent settings per COM port • Mixed protocol support • USB-serial scaling | Serial Details ↓ |
| Capture | Mode: On/Off Fill: Auto Value/Default Value |
Automatically build Modbus maps from client requests • Live traffic analysis • Reverse engineering capability | Capture Details ↓ |
| Simulate | Timing: Ts(1-65535ms), Freq(0.01-1000Hz) Patterns: Mathematical functions |
Sine/Ramp/Random/Static/Step waves • Per-point control • Data type aware simulation | Simulate Details ↓ |
| Server | Operation: Start/Stop all servers Stats: TX/RX counters Monitor: Connection count |
Multi-threaded architecture • Concurrent TCP+Serial operation • Performance monitoring | Server Details ↓ |
Detailed Group Breakdown:
Network-based Modbus server configuration
| Control | Options | Function |
|---|---|---|
| Interface | TCP, UDP | Select network protocol (TCP or UDP) |
| Port | 1-65535 | Server listening port (502 = standard Modbus) |
| Protocol Options | Default, RTU, ASCII | Modbus protocol variant over TCP/UDP |
| IP Configuration | IPv4, IPv6, Both, Loopback | Network interface binding options |
| Enable | Checkbox | Activate TCP/UDP server when Start is pressed |
Six Network Protocol Combinations:
- TCP + Default = Standard Modbus TCP server
- TCP + RTU = Modbus RTU protocol over TCP
- TCP + ASCII = Modbus ASCII protocol over TCP
- UDP + Default = Standard Modbus UDP server
- UDP + RTU = Modbus RTU protocol over UDP
- UDP + ASCII = Modbus ASCII protocol over UDP
IP Configuration Options:
COM port-based Modbus server configuration
| Parameter | Options | Purpose |
|---|---|---|
| COM Port | Available ports | Select COM port(s) for serial servers |
| Baud Rate | 300-921600 bps | Serial communication speed |
| Data Bits | 7, 8 | Character size (8 for RTU, ⅞ for ASCII) |
| Parity | None, Even, Odd, Mark, Space | Error detection method |
| Stop Bits | None, One, Two, 1.5 | Character termination |
| Protocol | Default/RTU, ASCII | Default: Start Modbus RTU server on selected COM Port RTU: Same as default (binary protocol) ASCII: Modbus ASCII server on selected COM Port |
Multiple COM Port Support: - Simultaneous Servers - Enable multiple COM ports concurrently - Individual Settings - Each COM port has independent baud/parity/stop bit settings - Mixed Protocols - Run RTU on COM1, ASCII on COM2 simultaneously - Scalable Configuration - Support for COM1 through high-numbered USB ports
Common Serial Configurations:
Intelligent traffic analysis and map building
| Feature | Mode | Behavior |
|---|---|---|
| Capture Toggle | On/Off | Enable the addition of Modbus Monitoring points based on Modbus Requests. Note: The server must be running for this feature to work. |
| Default Value 0 | Fill with zero | Fill "0" as the value into the newly created Modbus Map entries |
| Auto Value | Fill with address | Use the Modbus Register address as the fill value for newly created entries |
How Capture Works:
1. Server Running - Capture only works when server is active
2. Client Requests - Monitor incoming Modbus function codes and addresses
3. Auto Creation - Automatically create monitor points for requested registers
4. Value Population - Fill with address value or default zero
5. Map Building - Build complete device map from observed traffic
Use Cases:
- Reverse Engineering: When you don't have documentation for a Modbus device
- Start XPF Server on same network/port
- Let existing client connect and communicate
- XPF captures all register accesses automatically
- Result: Complete Modbus map discovered from live traffic
- System Analysis: Understanding existing Modbus networks
- Place XPF between client and server (monitoring mode)
- Capture reveals which registers are actually used
-
Identify active vs. unused registers
-
Protocol Validation: Testing client implementations
- Enable capture while your client polls the server
- Verify client is requesting correct registers
- Check function codes and access patterns
Capture Best Practices
- Start with clean list: Clear monitor points before enabling capture
- Use Default Value 0: Easier to identify newly captured points
- Let it run: Allow all client operations to complete for full map
- Review results: Captured points may need refinement (names, data types)
- Save immediately: Export captured map before making changes
Advanced dynamic data generation engine
| Control | Range | Purpose |
|---|---|---|
| Ts (Sample Time) | 1-65535 ms | Update rate for simulation engine |
| Freq (Frequency) | 0.01-1000 Hz | Sine wave frequency for dynamic simulation |
| Sample Button | Action | Add sample monitor point with sine wave pattern |
| Toggle Button | Action | Enable/disable simulation on all monitor points |
| Max/Default/Min | Actions | Set all simulated values to maximum/default/minimum ranges |
Simulation Patterns Available:
- Sine Wave - Value = Amplitude × sin(2π × Freq × t)
- Ramp - Linear increase/decrease over time
- Random - Random values within data type range
- Static - User-defined constant values
- Step - Square wave patterns
Advanced Features: - Nyquist Rate - Values update twice per sample time for accurate waveform generation and anti-aliasing - Per-Point Control - Enable simulation individually via monitor point checkboxes - Data Type Aware - Simulation respects INT16, UINT32, FLOAT32 ranges automatically - Real-Time Updates - Clients see live changing data with microsecond precision timing - Performance Optimized - Efficient multi-threaded calculations support hundreds of simultaneous simulations - Deterministic Behavior - Reproducible waveforms ensure consistent test results across multiple runs - Dynamic Range Control - Automatic amplitude scaling prevents data type overflow while maintaining pattern integrity
Simulation Control Groups
Master Simulation Controls (Server Tab → Simulate Group):
| Control | Function | Range/Options | Purpose |
|---|---|---|---|
| Ts (Sample Time) | Update Rate | 1-1000000ms | How often simulation values update (Nyquist rate: values change twice per Ts period) |
| Freq (Frequency) | Waveform Frequency | 0.01-1000000 Hz | Sine wave frequency for dynamic simulation |
| Sample Button | Add Sample Point | Action | Creates a sample monitor point with sine wave pattern for testing |
| Toggle Button | Global Enable/Disable | On/Off | Enable or disable simulation on monitor points simultaneously |
| Max Button | Set Maximum Values | Action | Sets all simulated monitor points to their maximum data type values |
| Default Button | Set Default Values | Action | Sets all simulated monitor points to their default/middle values |
| Min Button | Set Minimum Values | Action | Sets all simulated monitor points to their minimum data type values |
Individual Monitor Point Simulation Settings
Per-Point Simulation Configuration (Monitor Points Extended Options):
To configure simulation for individual monitor points:
- Access Extended Options:
- Click the three dots (...) button at the end of any monitor point row
-
Extended options dialog opens
-
Enable Point Simulation:
- Check the Simulate checkbox to enable simulation for this specific point
- Unchecked: Point uses static values or real device data
-
Checked: Point generates dynamic simulated values
-
Select Simulation Pattern:
- Choose from the Simulate Type dropdown menu
- Each pattern creates different mathematical behaviors
Available Simulation Patterns
Mathematical Waveform Types:
| Pattern | Formula | Behavior | Use Case |
|---|---|---|---|
| Linear | Value = m × t + b |
Straight line increase/decrease over time | Ramp signals, gradual changes, startup sequences |
| Sine | Value = Amplitude × sin(2π × Freq × t) |
Smooth oscillating wave | AC power simulation, cyclic processes, vibration |
| Triangle | Triangular wave function | Linear rise and fall pattern | Sawtooth generators, scanning signals |
| Square | Digital high/low alternating | Sharp on/off transitions | Digital signals, relay operations, binary states |
| Impulse | Short duration peaks | Brief spikes returning to zero | Event triggers, fault injection, pulse counting |
| Parabola | Value = a × t² + b × t + c |
Curved acceleration/deceleration | Non-linear processes, acceleration curves |
| Exponential | Value = A × e^(k × t) |
Exponential growth/decay | Temperature curves, charging/discharging, chemical reactions |
Advanced Client Testing & Performance Capture
Comprehensive Modbus Client Validation Platform:
XPF's simulation engine provides unparalleled capabilities for testing, validating, and benchmarking Modbus client applications. The combination of advanced waveform generation with integrated capture and analysis tools creates the industry's most comprehensive testing environment.
Client Performance Testing Capabilities:
| Test Category | XPF Capability | Client Validation | Performance Metrics |
|---|---|---|---|
| Response Time Testing | Variable Ts (1-65535ms) | Measure client polling efficiency | Identify optimal poll rates, detect timeouts |
| Data Pattern Handling | 7 mathematical waveforms | Verify client processes all data types correctly | Test floating-point precision, range validation |
| Load Testing | Hundreds of simultaneous points | Stress-test client under heavy data loads | Measure throughput limits, memory usage |
| Frequency Response | 0.01-1000Hz patterns | Test client adaptation to data rate changes | Analyze filtering, sampling, aliasing effects |
| Error Recovery | Impulse/fault injection | Validate client error handling capabilities | Document recovery times, fault tolerance |
| Network Performance | TCP/UDP/Serial protocols | Test client across all interface types | Compare protocol efficiency, latency analysis |
| Scalability Analysis | Multi-server architecture | Test client with multiple simultaneous connections | Evaluate connection management, resource scaling |
Integrated Data Capture & Analysis:
Real-Time Performance Monitoring:
- TX/RX Statistics: Monitor message throughput and communication efficiency
- Response Time Analysis: Measure client polling intervals and response latency
- Error Rate Tracking: Capture communication failures and timeout events
- Data Integrity Validation: Verify client receives and processes simulated values correctly
- Network Load Assessment: Analyze bandwidth utilization and protocol overhead
Automated Test Documentation: - Auto Save Integration: Automatically log all simulation data and client responses to timestamped CSV files - Chart Integration: Real-time visualization of client performance metrics and response patterns - Capture Integration: Record which registers clients actually access during testing - Statistics Export: Export comprehensive test results for analysis in Excel, MATLAB, or custom tools
Simulation Engine Technical Features
Advanced Waveform Generation:
- Mathematical Precision: IEEE 754 floating-point calculations ensure accurate waveform generation
- Nyquist Rate Processing: Values update twice per sample time (Ts) for accurate waveform generation and anti-aliasing
- Data Type Awareness: Simulation automatically respects INT16, UINT32, FLOAT32 value ranges and scaling
- Real-Time Updates: Connected clients see live changing data with microsecond precision timing
- Per-Point Control: Enable simulation individually for each monitor point with independent patterns
- Performance Optimized: Efficient multi-threaded calculations support hundreds of simultaneous simulations
- Deterministic Behavior: Reproducible waveforms ensure consistent test results across multiple runs
- Dynamic Range Control: Automatic amplitude scaling prevents data type overflow while maintaining pattern integrity
Practical Simulation Applications
Industrial Process Simulation
Scenario: Simulate a temperature control system
Configuration:
Setpoint (40001): Static = 85.0°C (no simulation)
Process Variable (40002): Sine wave = 83-87°C oscillation
Heater Output (40003): Parabola = non-linear response curve
Alarm Status (10001): Square wave = periodic alarm testing
Benefits: - Test PID controller tuning algorithms - Validate HMI alarm handling - Simulate process disturbances - Train operators on system behavior
Power Grid Simulation
Scenario: Simulate electrical power monitoring
Configuration:
Voltage (30001): Sine = 240V ± 5% @ 60Hz
Current (30002): Sine = Load-dependent amplitude
Frequency (30003): Linear = 59.95-60.05 Hz drift
Power Factor (30004): Triangle = 0.8-1.0 oscillation
Benefits: - Test SCADA power quality monitoring - Validate protection relay logic - Simulate grid disturbances - Demonstrate power calculation accuracy
Motor Drive Testing
Scenario: Variable frequency drive simulation
Configuration:
Speed Command (40010): Linear ramp = 0-1800 RPM acceleration
Actual Speed (40011): Exponential = realistic acceleration curve
Motor Current (40012): Parabola = torque-dependent current
Fault Status (10010): Impulse = periodic fault injection
Benefits: - Test drive commissioning procedures - Validate safety logic responses - Simulate motor startup sequences - Train maintenance personnel
Simulation Best Practices
Optimization Guidelines
Performance Considerations:
Sample Time (Ts) Selection: - Fast processes: 50-100ms for high-speed control loops - Normal processes: 1000ms (1 second) for typical industrial monitoring - Slow processes: 5000ms+ for temperature, level, or flow applications - Network considerations: Longer Ts reduces network traffic
Frequency Selection: - Power systems: 50/60 Hz for electrical simulation - Mechanical systems: 0.1-10 Hz for typical machinery - Process control: 0.01-1 Hz for chemical/thermal processes - Test signals: 1-100 Hz for calibration and testing
Simulation Limitations
Resource Considerations:
- CPU Usage: Many simultaneous simulations may impact system performance
- Network Load: High-frequency simulations generate continuous network traffic
- Data Type Limits: Simulation values are constrained by monitor point data types
- Mathematical Precision: Floating-point calculations may have minor rounding effects
Recommendations: - Start with fewer simulation points and increase gradually - Use appropriate sample times for your application - Monitor system performance during heavy simulation loads
Advanced Testing Scenarios & Methodologies
Comprehensive Client Validation Workflows:
Complete SCADA System Validation
Scenario: Validate a new SCADA application before production deployment
XPF Testing Strategy:
Phase 1 - Basic Connectivity:
  - Static values: Verify basic Modbus communication
  - Capture mode: Document actual register usage
  - Single pattern: Test with simple sine wave

Phase 2 - Dynamic Response:
  - Multiple patterns: Sine, triangle, linear ramps
  - Variable frequencies: 0.1Hz to 10Hz testing
  - Data type validation: INT16, UINT32, FLOAT32

Phase 3 - Stress Testing:
  - 100+ simultaneous points: Maximum load testing
  - High-frequency patterns: Performance limits
  - Error injection: Impulse patterns for fault testing

Phase 4 - Performance Analysis:
  - Auto save enabled: Complete data logging
  - Charts active: Real-time performance visualization
  - Statistics monitoring: TX/RX analysis
Validation Results: - Response Time Baseline: Document optimal polling intervals - Load Capacity: Identify maximum sustainable data points - Error Recovery: Validate fault handling and recovery times - Data Accuracy: Verify floating-point precision and range handling - Network Efficiency: Measure protocol overhead and bandwidth usage
Industrial Protocol Benchmarking
Scenario: Compare Modbus TCP vs RTU vs ASCII performance
Multi-Protocol Testing:
TCP Server (Port 502):
  - Linear ramps: 0-65535 over 60 seconds
  - Sine waves: 50Hz power simulation
  - Exponential: Temperature rise curves

Serial RTU (COM1 @ 115200):
  - Identical patterns as TCP
  - Same timing parameters
  - Parallel execution

Serial ASCII (COM2 @ 9600):
  - Identical patterns with lower baud
  - Protocol overhead comparison
  - Legacy compatibility testing
Performance Comparison: - Throughput Analysis: Messages per second across protocols - Latency Measurement: Response time differences - Error Rates: Protocol reliability under stress - Bandwidth Efficiency: Data overhead comparison - Scalability Limits: Maximum points per protocol
Competitive Advantages - Why XPF is Unmatched
No Other Tool Provides This Level of Testing Capability:
Mathematical Precision:
- Perfect Waveforms: Generate ideal mathematical patterns impossible with hardware
- Floating-Point Accuracy: IEEE 754 precision for scientific applications
- Deterministic Patterns: Reproducible test conditions for validation
- Multi-Pattern Synthesis: Complex waveform combinations for comprehensive testing
Comprehensive Integration: - Capture + Simulation: Reverse engineer while generating test patterns - Charts + Performance: Real-time visualization of client behavior - Auto Save + Analysis: Automatic test documentation and data export - Multi-Server + Protocols: Complete protocol stack validation
Enterprise-Level Capabilities: - Zero Hardware Dependency: Complete testing environment in software - Unlimited Scalability: Hundreds of simultaneous simulation points - Professional Documentation: Automated test reports and compliance records - Cost Effectiveness: Eliminates need for expensive test equipment
Time-to-Market Acceleration: - Instant Environment: No hardware setup or procurement delays - Parallel Development: Multiple team members can test simultaneously - Continuous Integration: Automated testing in CI/CD pipelines - Risk Reduction: Comprehensive validation before hardware deployment
Integration with Other XPF Features
Combining Simulation with Complete Testing Ecosystem:
Data Analysis Pipeline: - Charts: Real-time waveform visualization and client response analysis - Auto Save: Automatic CSV export for statistical analysis in Excel/MATLAB/Python - Capture: Simultaneously record client access patterns while generating test data - Statistics: Monitor communication performance and identify bottlenecks
Multi-Interface Testing: - Multiple Servers: Run different patterns on TCP vs Serial for protocol comparison - Mixed Protocols: Test RTU, ASCII, and TCP simultaneously with identical data - Network Analysis: Compare IPv4, IPv6, and serial communication efficiency
Advanced Validation: - Limits Evaluation: Set High/Low limits to test alarm and exception handling - Dynamic Scaling: Vary amplitude and frequency during testing for adaptive algorithm validation - Pattern Synchronization: Coordinate multiple simulation points for complex system testing - Error Injection: Use impulse patterns to test client fault tolerance and recovery
Server Start/Stop - Concurrent Operation
Both the Modbus TCP server (when Enabled) and Modbus RTU server start simultaneously (when the COM port is selected).
Server Control:
- Single Button: One Start/Stop control manages all enabled servers
- Network Server: Starts either TCP or UDP server (not both) when Interface is configured and Enable is checked
- Serial Servers: Start automatically for all selected COM ports
- Simultaneous Start: Network server (TCP or UDP) plus all serial servers start together
- Independent Operation: Each server operates independently once started
- Clean Shutdown: Stop button properly closes all server connections
Status Indicators:
- Running: Button shows "Stop" and servers are active
- Stopped: Button shows "Start" and no servers are running
- Connection Count: (if displayed) Shows number of active client connections
Multiple Server Strategy
Common configuration patterns:
- Development: TCP on port 502 for SCADA testing
- Integration: TCP + Serial for mixed client testing
- Production Simulation: Multiple serial ports for multi-device emulation
- Protocol Testing: Same data on TCP and Serial for comparison
Multiple Server Instances - Advanced Setup
Run multiple XPF instances for complex testing scenarios:
Interface Limitations per Instance:
Each XPF instance can run: - One Network Server: Either TCP OR UDP (not both) - Multiple Serial Servers: Unlimited COM ports with independent settings
Multiple Instance Strategies:
Strategy 1 - Different Network Protocols: - Instance 1: TCP Server on Port 502 + Serial servers (COM1, COM3) - Instance 2: UDP Server on Port 502 + Serial servers (COM5, COM7) - Instance 3: TCP Server on Port 503 + Serial servers (COM9, COM11)
Strategy 2 - Protocol Variants:
- Instance 1: TCP Default on Port 502
- Instance 2: TCP RTU on Port 602
- Instance 3: UDP ASCII on Port 503
Each instance: - Runs as separate XPF application window - Has its own Modbus map configuration - Responds independently to client requests - Simulates different devices or device types
Benefits:
- TCP and UDP Together: Use separate instances for both TCP and UDP servers
- Different Ports: Multiple network servers on different ports
- Device Simulation: Each instance represents different device type or model
- Protocol Testing: Compare TCP vs UDP performance with same data
6. IoT Features
XPF provides IoT connectivity through licensed features accessed via the IoT Tab. These features enable cloud integration, MQTT messaging, and specialized platform connectivity for Industrial IoT scenarios.
Available IoT Features
ThingSpeak Feature: Specialized ThingSpeak cloud platform integration with automatic field mapping and professional visualization capabilities.
📖 Complete ThingSpeak Feature Setup Guide
MQTT Feature: Advanced MQTT broker connectivity with multi-broker support, enterprise security, and cloud platform templates.
📖 Complete MQTT Feature Setup Guide
Feature Licensing
Both IoT features require separate license purchases to unlock full functionality. Access feature configuration through the IoT Tab groups after licensing.
6A. HMI Tab and Widgets (v5.0.0.0+)
The HMI tab provides a widget-based dashboard surface for building operator-friendly runtime views directly in XPF.
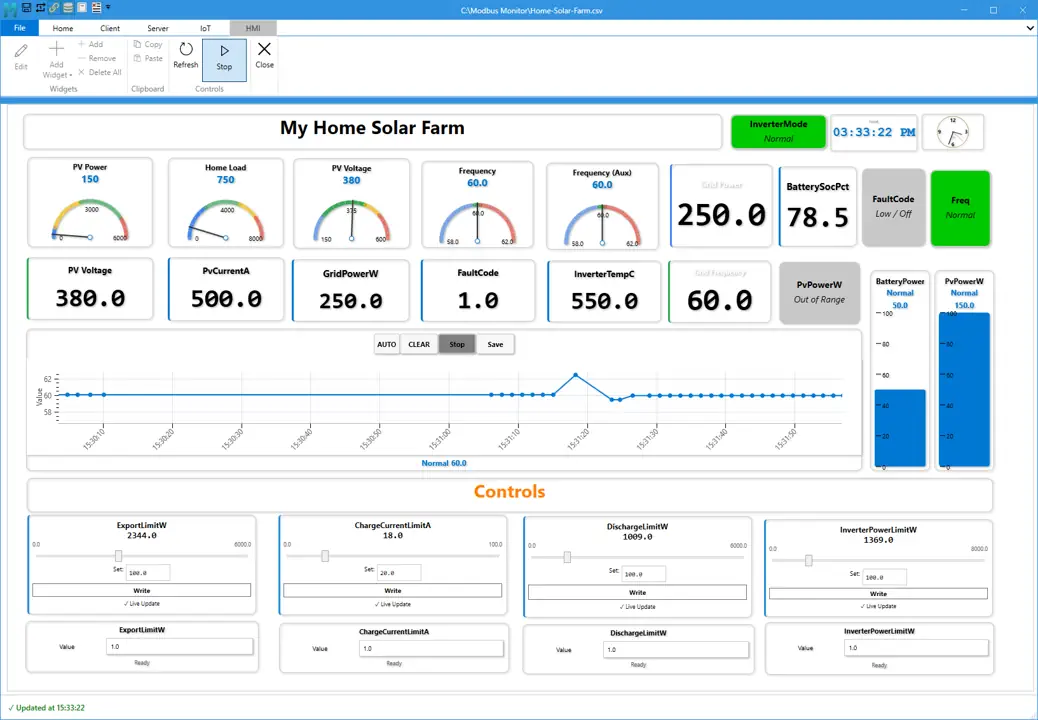 Example HMI dashboard layout in XPF
- Use the HMI feature to build live dashboards with widgets, monitor points, trends, and operator controls.
- Use it when you need a simple screen for commissioning, monitoring, or operator use.
Open the dedicated HMI guide:
7. Monitor Points Configuration
Monitor Points are similar to PLC tags - each one represents a specific data point you want to read or write on a Modbus device. Just as PLC tags map to memory addresses in a controller, Monitor Points map to Modbus registers and coils with all the configuration needed to access and interpret the data correctly.
This section explains everything you need to know about configuring Monitor Points, including address formats, data types, scaling options, and advanced features. Whether you're setting up a simple temperature sensor or complex multi-register data structures, understanding these configuration options is essential for effective Modbus communication.
Quick Navigation - Monitor Points Configuration
Most Common Topics:
| Topic | Link | Use Case |
|---|---|---|
| Magic Codes | Name Field Enhanced | String length, poll rates, bit access, date/time |
| Address Format | 6-Digit Format | Understanding 400001, 300001, etc. |
| Data Types | Data Interpretation | INT16, FLOAT32, STRING, DATETIME |
| Byte Order | Swap Type | Big/Little Endian for 32-bit+ values |
| Scaling | Gain & Offset | Convert raw values to engineering units |
| Custom Commands | CustomQ Field | Send raw PDU commands |
| Charts | Chart Options | Real-time data visualization |
| Simulation | Simulate Mode | Generate test data patterns |
Monitor Points Structure
Each row in the Monitor Points table represents a single Modbus register or group of registers to monitor:
| Number | Column | Data Type | Example | Description |
|---|---|---|---|---|
| 1 | Name | String | Water Temperature:16 |
Descriptive name + magic codes for advanced features |
| 2 | Address | Integer | 400001 |
6-digit Modbus address format |
| 3 | Unit ID | Byte (1-247) | 1 |
Slave/Station ID (1-247) |
| 4 | Gain | Float | 1.5 |
Scaling multiplier: Y = (Gain * X) + Offset |
| 5 | Offset | Float | 100 |
Value offset: Y = (Gain * X) + Offset |
| 6 | Data Type | Enum | INT16 |
Data interpretation format (INT16, UINT16, FLOAT32, STRING, etc.) |
| 7 | Swap Type | Enum | ABCD_BE |
Byte/word order for multi-register data |
| 8 | Value | String/Number | 123.45 |
Shows latest polled value, red border for errors, editable for writes |
| 9 | Extra (...) | Button | ... |
Additional Options such as CommandQ, Chart, Simulate |
| 10 | CustomQ | Hex String | 11 04 00 6B |
Custom Modbus command in hexadecimal |
| 11 | Chart | Checkbox | Checked / Unchecked | Enable charting for this monitor point to display value trends over time |
| 12 | Axis | Integer | 0 or 1 |
Assign to chart axis (0 or 1) for multi-scale time-series visualization |
| 13 | Simulate | Checkbox | Checked / Unchecked | Enable simulation mode (Server mode only) to generate test values without actual device |
Detailed Field Descriptions
1. Name Field - Enhanced with Magic Codes
The Name field supports special Magic Key Codes to enhance functionality:
String Length Control
Poll Rate Control
Format: @xxxx (milliseconds)
Usage: Model Name@1000
Effect: Polls every 1000ms (1 second)
Special: @-1 = Poll once at start, @0 = Skip during polling
Bit Field Access
Date/Time Formats
DATETIME Display Format - To display Date Time values with Magic Codes, you need to add a Magic Code to the Name field and set the Data Type to DATETIME. The processor uses the code (DOS, EPOCH, DT3, DT4, etc.) in the Name field to properly request the number of registers required for this display format to decode and display time properly.
No Modbus Standard for DateTime
There is no official Modbus standard for date time representation, so analyze the manufacturer's documentation to determine the number of registers required to fetch date and time. Then, simply choose the correct Magic Code from the table below. Use Swap Type settings to match the remote device's byte order.
DateTime Magic Codes:
| Magic Code | Registers | Register Layout | Description |
|---|---|---|---|
| DOS | 2 | [YYMMDD] [hhmmss] |
DOS Time Stamp Y1980, 2 Registers |
| WIN | 2 | Same as DOS | Windows compatible DOS format |
| EPOCH | 2 | Unix timestamp (32-bit) | Unix Epoch, 2 Registers |
| EPOCHMS | 4 | Unix timestamp (64-bit ms) | Unix Epoch in Milliseconds (4 Registers) |
| DT2 | 2 | [Date] [Time] |
Same as DOS format |
| DT3 | 3 | [YY\|MM] [DD\|hh] [mm\|ss] |
Date Time, 3 Registers |
| DT4 | 4 | [YY\|MM] [DD\|hh] [mm\|ss] [ms] |
Date Time, 4 Registers |
| DT4P | 4 | [XX\|YY] [MM\|DD] [hh\|mm] [ms] |
Date Time Y2000 Modbus Plus, 4 Registers |
| DT6 | 6 | [YYYY] [MMMM] [DDDD] [HHHH] [MMMM] [SSSS] |
Date Time, 6 Registers |
| DT7 | 7 | [Sec\|Min] [Hour\|Day] [Month\|Year] [Weekday] |
Date Time, 7 Registers |
Detailed Format Specifications:
DOS Time Stamp Y1980 - Uses Windows API DosDateTimeToFileTime()
| Register | Format | Description |
|---|---|---|
| N | YY\|MM\|DD |
Date: Year|Month|Day |
| N+1 | hh\|mm\|ss |
Time: Hour|Minute|Second |
Windows API Function:
3-Register DateTime - Common in Samsung Battery Systems
Usage: BMS_RTC_DT3 + Data Type = DATETIME
Example: Samsung Battery System BMS RTC Write [YY-MM-DD hh:mm:ss]
Registers: 3
| Register | Hex Address | Format | Description |
|---|---|---|---|
| N | 0x0000 | YY\|MM |
MSB(Year) - LSB(Month) |
| N+1 | 0x0001 | DD\|hh |
MSB(Day) - LSB(Hour) |
| N+2 | 0x0002 | mm\|ss |
MSB(Minute) - LSB(Second) |
Example Addresses:
4-Register DateTime with Milliseconds
| Register | Format | Description |
|---|---|---|
| N | YY\|MM |
Year|Month |
| N+1 | DD\|hh |
Day|Hour |
| N+2 | mm\|ss |
Minute|Second |
| N+3 | fff |
Milliseconds |
Modbus Plus Y2000 DateTime Format
| Register | Format | Description |
|---|---|---|
| N | XX\|YY |
Year (2-digit, base 2000) |
| N+1 | MM\|DD |
Month|Day |
| N+2 | hh\|mm |
Hour|Minute |
| N+3 | ms |
Milliseconds |
6-Register DateTime - Full Separate Registers
| Register | Content | Description |
|---|---|---|
| N | YYYY |
Year (4 digits) |
| N+1 | MMMM |
Month (1-12) |
| N+2 | DDDD |
Day (1-31) |
| N+3 | HHHH |
Hour (0-23) |
| N+4 | MMMM |
Minute (0-59) |
| N+5 | SSSS |
Second (0-59) |
7-Register DateTime with Weekday
| Register | Format | Description |
|---|---|---|
| N | Sec\|Min |
Second|Minute |
| N+1 | Hour\|Day |
Hour|Day |
| N+2 | Month\|Year |
Month|Year |
| N+3 | Weekday |
Day of week (0-6) |
Implementation Examples:
DateTime Configuration Examples
Samsung Battery System:
PLC with DOS Format:
Industrial Controller with Full DateTime:
Important Notes:
- Always set Data Type = DATETIME when using DateTime Magic Codes
- Use Swap Type settings to match device byte order (ABCD_BE, CDBA_LE, etc.)
- Consult manufacturer documentation for register layout and byte ordering
- Test with known timestamps to verify correct interpretation
- Some devices may use zero-based or one-based addressing - adjust accordingly
Multiple Magic Codes
2. Address Field - 6-Digit Format
Complete 6-Digit Addressing Guide
For comprehensive explanations, troubleshooting, and examples: See the 6-Digit Addressing Scheme Guide
This section provides XPF-specific details. The comprehensive guide covers all aspects including common mistakes, device compatibility, and conversion from other tools.
The 6-digit addressing format provides an explicit and standardized way to identify both the register type and its address in a single number. This format is used in XPF and many other Modbus tools to simplify configuration.
Format Structure:
Example: 400001 breaks down as: - 4 = Register Type Indicator (Holding Register) - 00001 = Register Number (1)
Critical: Prefix Digit ≠ Function Code
Important: The first digit is a register type indicator, not the Modbus function code itself (though they're related).
- Type Prefix → Tells you what kind of register (Coil, Discrete Input, Input Register, Holding Register)
- Function Code → The actual Modbus command used to read/write that register type
For example, address 400001 uses type prefix 4 (Holding Register), which is typically accessed using Function Code 03 (Read) or 06/16 (Write).
Quick Reference Table:
| Prefix | Register Type | Function Codes | Address Range | Access |
|---|---|---|---|---|
| 0 | Coils | FC01 (Read) / FC05, FC15 (Write) | 000001–065536 | Read/Write |
| 1 | Discrete Inputs | FC02 (Read) | 100001–165536 | Read Only |
| 3 | Input Registers | FC04 (Read) | 300001–365536 | Read Only |
| 4 | Holding Registers | FC03 (Read) / FC06, FC16 (Write) | 400001–465536 | Read/Write |
Visual Breakdown:
graph LR
    ADDR["400001"] -->|"Split into"| TYPE["4<br/>Holding Register"]
    ADDR -->|"Split into"| NUM["00001<br/>Register #1"]

    TYPE -.->|"Uses"| FC["Function Codes:<br/>03 (Read)<br/>06/16 (Write)"]
    NUM -.->|"Actual Address"| ZERO["Zero-based: 0<br/>One-based: 1"]

    style ADDR fill:#e3f2fd,stroke:#1976d2,stroke-width:3px,font-size:16px
    style TYPE fill:#fff3e0,stroke:#f57c00,stroke-width:2px
    style NUM fill:#f3e5f5,stroke:#7b1fa2,stroke-width:2px
    style FC fill:#e8f5e9,stroke:#388e3c,stroke-width:2px
    style ZERO fill:#ffebee,stroke:#c62828,stroke-width:2px
Key Concepts:
- First digit (0, 1, 3, or 4): Indicates register type (not function code directly)
- Last five digits (00000–65535): The actual register address
- Zero-based vs One-based: Devices may start counting from 0 or 1
- Zero-based: First register = 0 (e.g.,
400000) - One-based: First register = 1 (e.g.,
400001)
Address Examples - Understanding the Format
Complete breakdown showing all components:
| 6-Digit Address | Type Prefix | Register # | Function Code | Physical Location | Zero-Based |
|---|---|---|---|---|---|
400001 |
4 (Holding) | 1 | FC03 (Read) | First holding register | 0 |
400123 |
4 (Holding) | 123 | FC03 (Read) | 123rd holding register | 122 |
300005 |
3 (Input) | 5 | FC04 (Read) | 5th input register | 4 |
000013 |
0 (Coil) | 13 | FC01 (Read) | 13th coil | 12 |
100008 |
1 (Discrete) | 8 | FC02 (Read) | 8th discrete input | 7 |
Converting from Other Modbus Tools
If you're used to entering "Function Code + Address" separately (like Modbus Poll):
| Your Tool Shows | XPF 6-Digit Format | Conversion |
|---|---|---|
| FC03, Address 123 | 400123 |
Prefix 4 + 00123 |
| FC04, Address 5 | 300005 |
Prefix 3 + 00005 |
| FC01, Address 13 | 000013 |
Prefix 0 + 00013 |
| FC02, Address 8 | 100008 |
Prefix 1 + 00008 |
Quick Reference:
- FC01/05/15 (Coils) → Prefix 0
- FC02 (Discrete Inputs) → Prefix 1
- FC03/06/16 (Holding Registers) → Prefix 4
- FC04 (Input Registers) → Prefix 3
Special Function Codes (Do NOT Use 6-Digit Address Format):
| Function Code | Hex | Description | Use Case |
|---|---|---|---|
| FC07 | 0x07 | Read Exception Status | Device error/status flags |
| FC08 | 0x08 | Diagnostics | Device diagnostic tests (requires Sub-Function) |
| FC11 | 0x0B | Get Comm Event Counter | Communication event counter |
| FC12 | 0x0C | Get Comm Event Log | Communication event log retrieval |
| FC17 | 0x11 | Report Server ID | Server/slave identification |
| FC43 | 0x2B | Encapsulated Interface Transport | MEI - Device ID, date/time sync |
| FC43-14 | 0x2B-0x0E | Read Device Identification | Manufacturer, model, serial strings (requires Device ID & Object ID) |
| FC43-15 | 0x2B-0x0F | Read Date and Time | Clock read |
| FC43-16 | 0x2B-0x10 | Write Date and Time | Clock synchronization |
Why No 6-Digit Format for Special Functions?
Special function codes (FC07, FC08, FC11, FC12, FC17, FC43) don't follow the 6-digit addressing scheme because they:
- Operate on device-level data (not specific registers)
- Use different request/response structures
- Require additional parameters (Sub-Function, Object ID, Device ID)
- Are configured through the Modbus Wizard with specialized fields
Choosing Address Mode: Zero-Based vs One-Based
Most devices use 1-based addressing (addresses start at 1), but some use 0-based (addresses start at 0).
- Check your device documentation for its addressing convention
- Use the Offset button in the List Group to switch between modes globally
400001(1-based) and400000(0-based) both refer to the first physical holding register
3. Unit ID (Slave/Station ID)
The Unit ID identifies which Modbus slave device to communicate with on the network:
| Range | Description | Common Usage |
|---|---|---|
| 1-247 | Valid Slave IDs | Standard Modbus device addressing |
| 0 | Broadcast address | Not recommended for normal operations |
| 248-255 | Reserved | Not used in standard Modbus |
Key Points: - Each device on a Modbus network must have a unique Unit ID - Use the Swap ID button in List Group to change all monitor points at once - TCP/IP devices often use Unit ID 1 or match their IP last octet
4. Gain (Scaling Multiplier)
Apply linear scaling to raw Modbus values using the formula: Y = (Gain * X) + Offset
| Value | Effect | Example |
|---|---|---|
| 1.0 | No scaling (default) | Raw value displayed as-is |
| 0.1 | Divide by 10 | Convert tenths to units (e.g., 235 → 23.5) |
| 10 | Multiply by 10 | Amplify small values |
| -1 | Invert sign | Convert positive to negative |
Common Applications: - Temperature conversion: Gain = 0.1 (tenths of degree to degrees) - Pressure scaling: Gain = 0.01 (convert to proper decimal places) - Current measurement: Gain = 0.001 (milliamps to amps)
5. Offset (Value Adjustment)
Add or subtract a constant from the scaled value: Y = (Gain * X) + Offset
| Value | Effect | Example |
|---|---|---|
| 0 | No offset (default) | Scaled value used as-is |
| -273.15 | Celsius to Kelvin | Temperature conversion |
| 32 | Celsius to Fahrenheit | After gain of 1.8 |
Processing Order: Raw Value → Gain (multiply) → Offset (add) → Display
6. Data Type (Data Interpretation)
Defines how to interpret the raw Modbus register data.
Available Data Types:
| Type | Size | Range | Usage |
|---|---|---|---|
| BIT | 1 bit | 0/1 | Boolean values |
| INT16 | 16-bit | -32,768 to 32,767 | Signed integers |
| UINT16 | 16-bit | 0 to 65,535 | Unsigned integers (default) |
| INT32 | 32-bit | ± 2.1 billion | Large signed numbers |
| UINT32 | 32-bit | 0 to 4.2 billion | Large unsigned numbers |
| FLOAT32 | 32-bit | IEEE 754 | Floating point numbers |
| INT64 | 64-bit | ± 9.2 x 10^18 | Very large integers |
| UINT64 | 64-bit | 0 to 1.8 x 10^19 | Very large unsigned |
| DOUBLE64 | 64-bit | IEEE 754 | Double precision float |
| HEX | Variable | Hexadecimal | Raw hex display |
| STRING | Variable | Text | Character strings |
| DATETIME | Variable | Date/Time | Formatted timestamps |
Most Common Types:
- UINT16: Unsigned 16-bit integer (0-65535) - default for most registers
- INT16: Signed 16-bit integer (-32768 to 32767) - for negative values
- FLOAT32: 32-bit floating point - for decimal precision
- STRING: Text data - use with
:xxmagic code for length
7. Swap Type (Byte/Word Order)
Controls byte ordering for multi-register data (32-bit, 64-bit values spanning multiple registers).
Available Swap Types:
| Swap Type | Description | Byte Order |
|---|---|---|
| ABCD_BE | Big-Endian (Default) | Most significant first |
| CDBA_LE | Little-Endian | Least significant first |
| BADC_BEBS | Big-Endian Byte Swap | Bytes swapped within words |
| CDAB_LEBS | Little-Endian Word Swap | Words swapped |
Quick Selection Guide: - ABCD_BE (Big-Endian): Try this first for most devices - CDBA_LE (Little-Endian): If ABCD shows wrong values - BADC_BEBS / CDAB_LEBS: For devices with swapped byte/word order
8. Value (Current/Display Value)
The Value field serves multiple purposes depending on mode and state:
| Mode | Display | Interaction |
|---|---|---|
| Client Mode | Shows latest polled value | Read-only, auto-updates during polling |
| Server Mode | Editable field | Click to edit, sends value to requesting clients |
| Error State | Empty with red border | Click cell to view error message details |
| Evaluate Mode | Color-coded background | Indicates pass/fail based on limits |
9. Extra (...) Button
Click the three dots (...) button at the end of each row to access extended options:
Available Options:
- Evaluate Limits: Set High/Low thresholds with color coding
- CustomQ:Custom Modbus command in hexadecimal
- Chart:Enable charting for this monitor point to display value trends over time
- Simulate:Simulation mode
10. CustomQ (Custom Modbus Command)
Send raw Modbus PDU commands in hexadecimal format for special function codes or manufacturer-specific commands.
Format: Space-separated hex bytes (PDU only, no MBAP header or CRC)
Examples:
11 04 00 6B 00 03    # Read File Record
14 0E 06 ...         # Write File Record
2B 0E 01 00          # Read Device Identification
Use Cases:
- Custom function codes not in standard Modbus
- Manufacturer-specific diagnostics
- Advanced MEI commands
- File transfer operations
11. Chart (Enable Charting)
Enable time-series charting for this monitor point to visualize value trends over time.
Complete Chart Guide
For detailed chart setup, configuration, and advanced features, see the Charts - Data Trends Visualization section below.
| State | Result |
|---|---|
| Checked | Values plotted on chart in real-time, click Chart Button in Client tab to view |
| Unchecked | Monitor point excluded from chart (default) |
Requirements: Client mode must be running (polling active) for data collection
12. Axis (Chart Axis Assignment)
Assign monitor point to specific chart axis for multi-scale visualization:
| Value | Purpose | Example |
|---|---|---|
| 0 | Left axis | Temperature (0-100°C) |
| 1 | Right axis | Pressure (0-1000 PSI) |
Benefits of Dual Axis:
- Compare values with different scales simultaneously
- Temperature and pressure on same chart
- Speed and current measurements together
Chart Axis Configuration
For complete dual-axis setup and multi-signal charting examples, see the Charts - Data Trends Visualization section below.
13. Simulate (Simulation Mode)
Enable simulation mode to generate test values without requiring an actual Modbus device.
| State | Mode | Behavior |
|---|---|---|
| Checked | Simulation ON | Generates test patterns (ramp, sine, random) |
| Unchecked | Normal mode | Uses actual device communication |
Available Only In: Server mode - allows testing without physical hardware
Simulation Patterns:
- Ramp: Incrementing values for testing trending
- Sine Wave: Oscillating pattern for dynamic testing
- Random: Random values within configured range
- Static: User-defined constant value
Advanced Features & Tips
Magic Code Reference
Quick reference for Name field enhancement codes:
| Code | Format | Purpose | Example |
|---|---|---|---|
| String Length | :nn |
Multi-register strings | Device_Name:16 |
| Poll Rate | @nnnn |
Custom timing (ms) | Status@5000 |
| Bit Access | .n |
Single bit from register | Alarm_Status.7 |
| Date/Time | DTx |
Timestamp conversion see Date/Time Format |
Timestamp_DT6 |
| Combined | Multiple | Complex configurations | Data@1000:8.5 |
Performance Optimization
Network Optimization
Fast LAN:
  Response Timeout: 1000ms
  Inter-Frame Delay: 5ms
  Poll Rate: 500ms

Slow Serial:
  Response Timeout: 5000ms
  Inter-Frame Delay: 50ms
  Poll Rate: 2000ms

WAN/Internet:
  Response Timeout: 10000ms
  Inter-Frame Delay: 100ms
  Poll Rate: 5000ms
Memory Management
- Disable Logging: Turn off when not needed
- Limit Chart Buffer: Set samples to reasonable size
- Filter Data: Use evaluate filters to reduce display load
Troubleshooting Guide
Common Connection Issues
| Problem | Symptoms | Solution |
|---|---|---|
| Timeout Errors | Red border in Value field | Check network, increase timeout |
| Wrong Values | Unexpected data | Verify swap type and data type |
| No Response | All values show errors | Check IP address, port, Unit ID |
| Slow Performance | Delayed updates | Optimize poll rates and timing |
Error Message Analysis
Click on red-bordered Value cells to see detailed error messages:
- Connection Refused: Server not running or wrong port
- Timeout: Network issues or device not responding
- Illegal Function: Unsupported Modbus function code
- Illegal Address: Register address not available on device
Best Practices
Configuration Management
- Save Frequently: Use CSV format for easy backup
- Document Settings: Include descriptive names for monitor points
- Version Control: Keep multiple versions of configurations
- Test Offline: Use server mode to validate configurations
Production Deployment
- Validate Configuration: Test thoroughly before production use
- Monitor Performance: Watch for timeout errors and timing issues
- Plan Maintenance: Schedule configuration updates during downtime
- Backup Data: Regular exports of historical data
Security Considerations
- Network Isolation: Use VPNs or isolated networks for Modbus
- Access Control: Limit who can modify configurations
- Audit Logging: Enable communication logs for security monitoring
- Regular Updates: Keep XPF updated with latest security patches
Additional Resources
Learning Materials
- YouTube Tutorials - Step-by-step video guides
- Technical Documentation - Protocol details and integration guides
- Community Forum - User discussions and support
Support Options
- Email Support: Direct assistance for licensed users
- Online Help: Comprehensive web-based documentation
- Professional Support: Premium support plans available
Related Products
- Android Monitor - Mobile Modbus monitoring
- Modbus Mapper Pro - Network analysis and protocol sniffing
- Custom Solutions - Tailored development services