Modbus Monitor Advanced - Complete User Manual
Professional mobile Modbus monitoring for advanced users and field engineers
Get Started Today
Download Modbus Monitor Advanced Quick Start (3 Steps)
Professional mobile Modbus monitoring with unlimited monitor points, sensor publishing, cloud integration, and priority support.
Need desktop? Try Modbus Monitor XPF for Windows.
Introduction
The Modbus Monitor Advanced is a comprehensive 3-in-1 solution: Modbus Client, Server, and Sensor Server in a single Android application. This professional app allows you to poll Modbus-speaking devices for data directly from your mobile device.
The Modbus Monitor Advanced operates in two primary modes: Master (Client) and Slave (Server). The operation, configuration, and communication differ based on the selected mode. The paid version includes all features of the free app and excels in professional features, configuration options, and ease of data input.
Master (Client) Mode: The app polls remote devices to retrieve data, which is then displayed in your chosen data format, including raw data.
Slave (Server) Mode: Your phone or tablet acts as a Modbus TCP Slave Device, allowing other devices on the network to poll your device for data.
The advantage of the Modbus Monitor Advanced is that it combines both modes in one application, eliminating the need to purchase separate apps.
Essential App Features:
- ⚙️ Settings - Configure protocols, timing, and cloud integrations
- 📤 Export/Import - CSV data management and email sharing
- ☁️ Cloud Add-ons - Log data to Google Sheets, ThingSpeak, or MQTT brokers with one-button setup
- 🔄 Data Management - Real-time logging, statistics, and data transformations
New to Cloud Logging?
The Google Sheets Add-on is the fastest way to get your Modbus data into the cloud—no server, database, or coding required. See Google Sheets Add-on Guide for a complete walkthrough.
Core Capabilities
Communication Channels (4):
- TCP/IP - Wi-Fi and Ethernet networks
- USB-OTG - Direct serial connections
- Bluetooth - Wireless serial communication
- Cloud/IoT - MQTT and custom protocols
Protocol Support (8):
Modbus TCP, UDP, Serial RTU, Serial ASCII, RTU over TCP, ASCII over TCP, ThingSpeak, Google Sheets, and MQTT
Data Management:
- CSV import/export with timed intervals (second/minute/hour) — see Import & Export Guide
- Email export and cloud integration (ThingSpeak, Google Sheets)
- Real-time logging and statistical analysis
Cloud Add-ons (Separate In-App Purchases)
Extend your monitoring with cloud logging add-ons. Each add-on provides direct cloud integration without servers or complex setup:
| Add-on | What It Does | Best For | Guide |
|---|---|---|---|
| Google Sheets | Log data directly to private Google spreadsheets | Quick setup, team sharing, Excel export | Setup Guide |
| MQTT | Publish to MQTT brokers (AWS IoT, HiveMQ, etc.) | IoT platforms, Node-RED, Home Assistant | MQTT Guide |
| ThingSpeak | Send data to ThingSpeak cloud analytics | Live charts, MATLAB analysis, public dashboards | ThingSpeak Guide |
Key Benefits:
- One-button setup - Create spreadsheets or connect to brokers with minimal configuration
- Automatic authentication - OAuth for Google, token management for MQTT
- Multi-device support - Multiple phones can log to the same destination
- Works with all modes - Client polling, Sensor Server, or mixed data sources
Operation Modes
- Client Mode: Poll remote devices with full protocol flexibility
- Server Mode: Turn Android into Modbus TCP slave device
- Sensor Mode: Expose phone sensors via Modbus TCP protocol and Modbus/TCP server
Requirements: Android 6.0+ (API23) with network and USB permissions; USB OTG support required for serial connections
First 60 Seconds (Rapid Quick Start)
Follow this ultra-short sequence the first time you open the app:
- Tap + to create a new monitor point (defaults load).
- Tap the new point → Change → set Channel
TCP/IP, ProtocolModbus TCP, IP, Port (e.g. 192.168.1.100:502), Address400001, Count2, Data TypeFLOAT32. - Press OK then tap Client Mode (link icon) → value appears (or
?????if settings need adjustment). - Optional: Set Button Write Value then use Write Preset Value to send a test value.
- Want cloud telemetry? Open Settings → MQTT, enter broker + topic prefix, enable, observe publish.
You are now reading, (optionally) writing, and ready to expand.
Getting Started
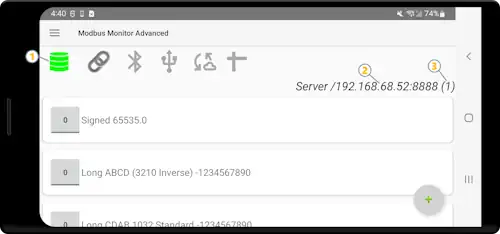
Main Interface Overview
The Modbus Monitor Advanced features an intuitive main interface designed for both novice and expert users. Understanding this interface is crucial for effective operation, as it serves as your command center for all Modbus communication activities.
Interface Design Philosophy: The main screen combines status indicators with action buttons for streamlined operation. Each visual element serves a specific purpose - status lights show what's happening, buttons control operations, and data displays provide real-time feedback. This unified design eliminates the need to navigate between multiple screens during normal operation.
For New Users: Don't be overwhelmed by the interface - you'll primarily use just a few key elements:
- The + button [10] to add new connections
- Monitor Points [9] to view your data
- Client Mode [3] to start/stop data collection
For Advanced Users: The interface provides comprehensive control over multiple simultaneous connections, with detailed statistics, server capabilities, and extensive configuration options all accessible from this single screen.
The main interface combines status indicators with action buttons for easy operation. Each row displays monitor points showing Name, Configuration details, current Modbus values, send/receive frames, and packet response times.

Key Components:
| Element | Reference | Description | Function |
|---|---|---|---|
| Hamburger Menu | [1] | Main application menu | Access settings, import/export, cloud setup |
| Server Mode | [2] | Server status/toggle | Start/stop Modbus TCP server functionality |
| Client Mode | [3] | Client status/toggle | Start/stop Modbus client polling |
| Bluetooth Status | [4] | Communication indicators | Bluetooth control and status |
| Serial Status | [5] | USB Serial indicators | USB and USB-OTG connected device control panel and connection status. Shows status or click to see available USB devices that can be used |
| IoT | [6] | IoT status | IoT controls and status |
| Google Sheets | [7] | Statistics display | Controls for Google Sheets |
| Packet Counters | [8] | Statistics display | Good/Bad packet counts and error tracking |
| Monitor Points | [9] | Data display area | Live values, config details, response times, click or swipe for edits |
| Monitor Points - Index | [9a] | Monitor point index and counter | Sequential monitor point number (i) and request attempt counter for tracking polling activity |
| Monitor Points - Value | [9b] | Primary data display line | Shows monitor point name, current live value, and optional engineering unit suffix for easy identification |
| Monitor Points - Config | [9c] | Configuration summary line | Displays key settings: communication channel, write function code, data type, byte swap, Modbus address, register count, slave ID, and scaling parameters |
| Monitor Points - Packet | [9d] | Communication packet display | Shows raw Modbus packet data for both transmitted requests and received responses for debugging and analysis |
| Monitor Points - Delay | [9e] | Communication timing metrics | Displays response time delay between packet transmission and reception, useful for network performance monitoring |
| Monitor Points - Preset | [9f] | Quick write button | Interactive button for instantly writing preset values to device when configured; requires proper write function code setup |
| Server Info | [10] | Network details | IP address and port when server is active |
| Quick Add | [11] | Add button | (+) button to create new monitor points |
Monitor Point Configuration Display
Monitor Point configuration details (elements 9c to 9e) can be hidden or shown using the "Hide or Unhide Configuration" menu option in the Monitor Point Management dialog.
Detailed Coverage Ahead
Each of these interface elements will be explained in comprehensive detail throughout this guide. The numbered references [1]-[10] correspond to the annotations in the screenshot above, making it easy to follow along. New users should focus on elements [3], [9], and [10] to get started, while advanced users can utilize all features for complex multi-device scenarios.
Quick Start (3 Steps)
Get Connected in 3 Steps
- Add Monitor Point - Press the + button to add a new Monitor Point with default settings
- Configure Connection - Click the Monitor Point and select "Change" to set up the Monitor Point. Click TCP/IP (Channel), set the IP Address and Port from a remote server, specify the Number of Registers, and the Protocol (Modbus TCP is the default)
- Start Monitoring - Click the Link icon to start polling the remote server and view the value
Navigation Guide
Quick Access to Key Sections:
| What You Want To Do | Go To Section | Key Features |
|---|---|---|
| Navigate the app interface | Hamburger Menu | Settings, import/export, cloud setup |
| Configure app behavior | Settings | Protocol settings, timing, cloud integration |
| Read data from devices | Client Mode | Poll remote servers, multiple protocols |
| Let others read your data | Server Mode | Turn phone into Modbus server |
| Expose phone sensors | Sensor Server Mode | Share accelerometer, gyro, etc. via Modbus |
| Understand data organization | Monitor Points | Core configuration concepts |
| Compare with other tools | Ecosystem Tools | QModMaster, pymodbus, ModScan, XPF |
| Troubleshoot issues | Troubleshooting | Common problems and solutions (Error Codes Guide) |
| Learn about hardware | Hardware Requirements | USB, Bluetooth, network setup |
| Publish local data to cloud | Cloud Publishing FAQ | MQTT / Sheets / ThingSpeak workflows |
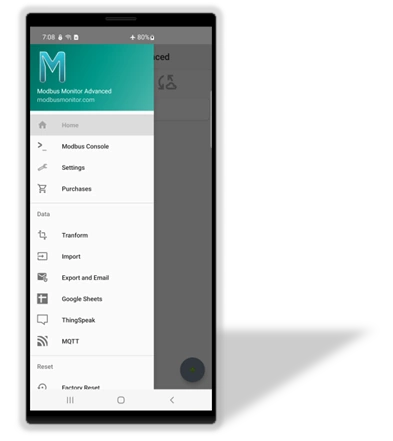
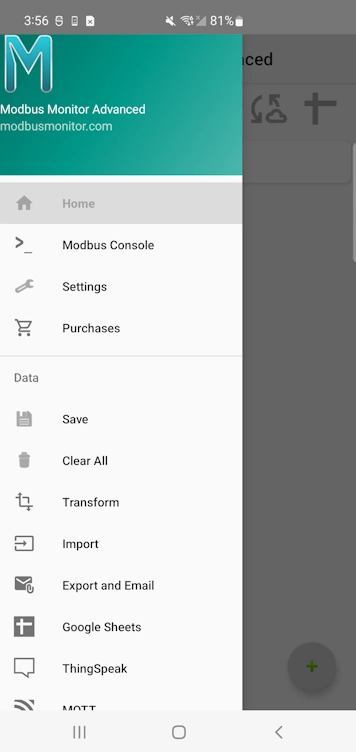
Hamburger Menu
-
-
Main Application Menu
Access advanced features through the hamburger menu:
Main
- Home - Return to the main monitoring interface
- Modbus Console - Simple console-style interface for basic Modbus communication (see Free version guide)
- Settings - Configure app behavior and protocols
- Purchases - Verify license and purchase status
Data
- Save - Save current monitor point configuration
- Clear All - Remove all monitor points and data
- Transform - Legacy transformation utility to convert old monitor points to new types
- Import - Load monitor points from CSV file in Downloads folder (Import & Export Guide)
- Export and Email - Export all monitor points and configuration data to CSV in Downloads folder and send via email (Import & Export Guide)
- Google Sheets - Real-time data publishing to spreadsheets (Add-on purchase required)
- ThingSpeak - IoT dashboard and data visualization (Add-on purchase required)
- MQTT - Industrial IoT messaging protocol (Add-on purchase required)
Reset & Maintenance
- Factory Reset - Restore app to default settings
- Reset Comm Counts - Clear communication statistics
- Reset Statistics - Reset performance counters
Exit
- Help - Access documentation links and application version information
- Exit - Close application completely
Settings
Access comprehensive app configuration through Hamburger Menu [1] Settings. The Settings screen organizes all configuration options into logical categories for easy management of communication protocols, timing parameters, logging options, cloud integrations, and hardware-specific settings.
Template settings for new monitor points in client mode operations.
| Setting | Type | Description | Default | Notes |
|---|---|---|---|---|
| IP Address | Text | Default IP address for new monitor points | Device IP | Template for TCP/IP connections |
| Port | Number | Default port for client connections | 502 | Standard Modbus TCP port |
| Slave ID | Number | Default Modbus slave ID | 1 | Applied to new monitor points |
| Auto Start | Switch | Start polling automatically when app launches | Disabled | Begins client mode on app start |
Template Functionality
These settings serve as templates when creating new monitor points, saving you from entering the same information repeatedly for similar devices.
Configuration options for Modbus Server Mode operation.
| Setting | Type | Description | Default | Notes |
|---|---|---|---|---|
| Server Port | Number | Port for Modbus TCP server | 8888 | See Server Configuration |
| Modbus Server | Switch | Show/hide server icon on main interface | Disabled | Enables Server Mode [2] |
| Auto Start | Switch | Automatically start server when app launches | Disabled | Useful for dedicated server deployments |
Server Configuration Cross-Reference
For detailed server setup including port guidelines and best practices, see the Server Configuration section.
Fine-tune communication timing and performance parameters.
| Setting | Type | Description | Default | Range | Notes |
|---|---|---|---|---|---|
| Timeout | Number | Packet response timeout (milliseconds) | 1000 | 100-30000 | Increase for slow networks |
| Retries | Number | Retry attempts for failed packets | 3 | 0-10 | 0 = no retries |
| Socket Timeout | Number | TCP socket connection timeout | 30000 | 1000-60000 | Network connection limit |
| Inter-Message Wait | Number | Delay between packets (milliseconds) | 20 | 0-5000 | Required for some devices |
| Interval | Number | Polling interval for monitor points | 1000 | 100-3600000 | How often to poll each point |
Performance Impact
Lower timeout values improve responsiveness but may cause failures on slow networks. Higher intervals reduce network traffic but delay data updates.
Wireless communication security and connection options.
| Setting | Type | Description | Default | Security Impact |
|---|---|---|---|---|
| Insecure Connections | Switch | Allow insecure Bluetooth pairing | Disabled | Enables connections to older devices |
Security Consideration
Insecure connections allow pairing with older Bluetooth devices that don't support modern security protocols. Enable only when necessary.
Battery optimization and power management settings.
| Setting | Type | Description | Default | Impact |
|---|---|---|---|---|
| Battery Saver | Switch | Stop communications during device sleep | Enabled | Improves battery life significantly |
Power Management
Battery Saver automatically pauses all communication when your device sleeps, extending battery life for mobile use.
Control data logging, packet display, and debugging functionality.
| Setting | Type | Description | Default | Purpose |
|---|---|---|---|---|
| Show TX/RX | Switch | Display packet data in interface | Disabled | Real-time packet debugging |
| Log Communications | Switch | Log TX/RX frames and other info | Disabled | Detailed communication logging |
| CSV Log Period | Number | CSV file logging interval (seconds) | 0 (disabled) | Automatic data export timing |
Debugging & Data Collection
Enable TX/RX display for real-time packet analysis. CSV logging saves data to Downloads folder for analysis.
Real-time data publishing to Google Spreadsheets (Add-on required).
| Setting | Type | Description | Default | Notes |
|---|---|---|---|---|
| Use Google Sheets | Switch | Enable Google Sheets data logging | Disabled | Requires Google account setup |
| Spreadsheet ID | Text | Target spreadsheet identifier | Default ID | From your Google Sheets URL |
| Create New Sheet | Switch | Create new sheet on app start | Disabled | Organizes data by session |
| Account Name | Text | Connected Google account | Not Set | Read-only display |
| Account Setup | Button | Configure Google account access | - | Opens account configuration |
Cloud Integration
Google Sheets integration requires the Google Sheets add-on purchase and Google account authentication.
IoT dashboard and data visualization platform (Add-on required).
| Setting | Type | Description | Default | Notes |
|---|---|---|---|---|
| Use ThingSpeak | Switch | Enable ThingSpeak data publishing | Disabled | Requires API key |
| Write API Key | Text | ThingSpeak channel write key | Default Key | From your ThingSpeak account |
| Test Sample Data | Button | Send test data to verify connection | - | Validates configuration |
IoT Platform
ThingSpeak provides real-time charts, alerts, and data analysis. Requires ThingSpeak add-on and free/paid ThingSpeak account.
Industrial IoT messaging protocol integration (Add-on required).
| Setting | Type | Description | Default | Notes |
|---|---|---|---|---|
| Use MQTT | Switch | Enable MQTT topic publishing | Disabled | Requires broker configuration |
| Server URI | Text | MQTT broker connection string | tcp://broker.hivemq.com:1883 | Include protocol and port |
| Client ID | Text | Unique client identifier | Empty | Auto-generated if blank |
| Username | Text | Broker authentication username | Empty | Leave blank for anonymous |
| Password | Password | Broker authentication password | Empty | Secure credential storage |
| QoS | Dropdown | Quality of Service level | 1 | 0=At most once, 1=At least once, 2=Exactly once |
| Sample Topic | Text | Test topic for publishing | modbusmonitor/testtopic1 | Used for testing connection |
| Test Panel | Button | Configuration and test interface | - | Validates MQTT setup |
Industrial Integration
MQTT enables integration with AWS IoT, Azure IoT, Google Cloud IoT, and industrial automation systems. Supports secure and reliable data streaming.
Client Mode - Polling Remote Devices
Client Mode transforms your Android device into a powerful Modbus Master that can poll multiple remote devices for live data. This is the primary mode for field engineers and technicians who need to monitor, troubleshoot, and analyze industrial systems.
Advanced Multi-Channel Capability: Each Monitor Point becomes a powerful data source with its own independent communication channel (Serial, TCP/IP, or Bluetooth). This allows you to collect data from different devices using different protocols simultaneously, enabling you to configure and monitor systems from various sources and build comprehensive system-level information from a single interface.
Configuration Essentials
To start polling in Master Mode, Modbus Monitor Advanced requires at least one monitor point. You can add a monitor point by clicking the (+) button or selecting "Add" from the menu. When you click "Add" or (+), a monitor point is added with default settings and values.
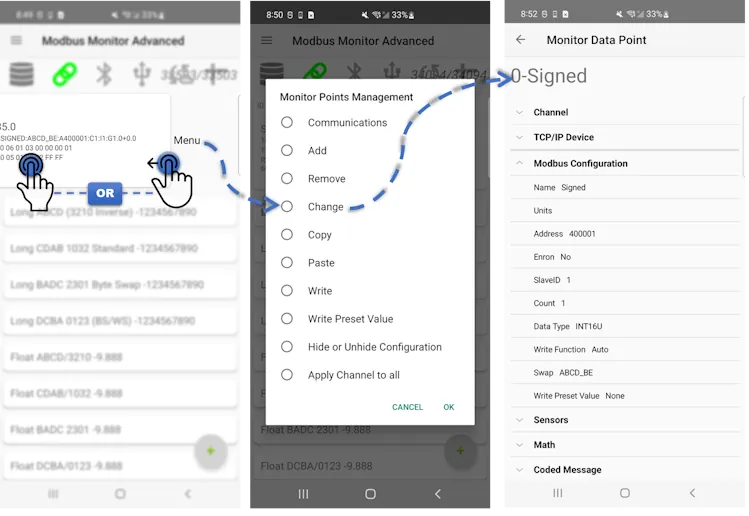
Monitor Points Management Dialog: This is your central command hub for modifying, configuring, and controlling individual Modbus points (registers or coils) within your list. See the detailed Monitor Points Management section for complete information about all available options.
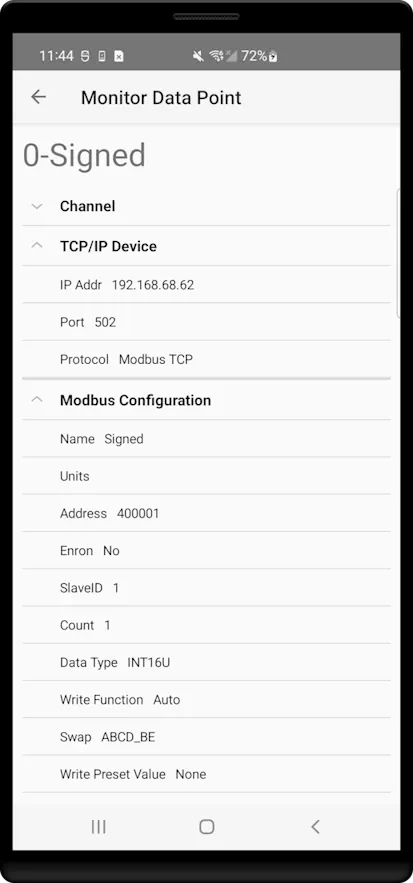
Monitor Point Configuration
Monitor point configuration defines how your app connects to and interprets data from Modbus devices. Each monitor point specifies the device address, register location, data format, and polling behavior for a specific piece of data you want to monitor or control.
-
-
Monitor Point Configuration Dialog
Configure each monitor point with detailed settings across five expandable sections:
Core Configuration
- Channel Settings - Communication interface and protocol selection
- Modbus Configuration - Address, register count, and display settings
- Sensor Server - Android sensor integration options
- Math - Linear transformation and scaling settings
- Coded Messages - Translate numbers to predefined strings
Quick Setup Steps:
- Add Monitor Point - Tap monitor point and select "Change" to edit
- Select Channel - Choose communication interface (TCP/IP, Serial, Bluetooth)
- Configure Protocol - Set compatible protocol for selected channel
- Set Connection - Configure IP address/port or baud rate
- Define Modbus - Set Slave ID, address, and register count
- Start Polling - Click "Link" icon to begin data collection
Channel Settings
Communication interface and protocol selection for your monitor point.
Physical communication interface selection.
| Setting | Type | Description |
|---|---|---|
| TCP/IP | Selection | Network communication via Wi-Fi or Ethernet |
| Serial Port | Selection | Direct USB-OTG serial communication |
| Bluetooth BR/EDR/LE | Selection | Wireless serial communication via Bluetooth |
Channel Descriptions: - TCP/IP: Best for networked devices, PLCs, and remote servers - Serial Port: Direct connection via USB-OTG adapters for legacy devices - Bluetooth: Wireless connection to Bluetooth-enabled Modbus devices
Modbus protocol variant selection based on chosen channel.
| Protocol | Compatible Channels | Description |
|---|---|---|
| None | All | Skip this monitoring point (disabled) |
| Modbus TCP | TCP/IP | Standard Modbus over TCP/IP networks |
| Modbus RTU over TCP | TCP/IP | RTU protocol encapsulated in TCP packets |
| Modbus UDP | TCP/IP | Modbus over UDP (connectionless) |
| Modbus ASCII over TCP | TCP/IP | ASCII protocol encapsulated in TCP packets |
| Modbus RTU | Serial, Bluetooth | Binary serial protocol for direct connections |
| Modbus ASCII | Serial, Bluetooth | ASCII serial protocol for direct connections |
Protocol Compatibility Matrix:
| Channel | Supported Protocols | Notes |
|---|---|---|
| TCP/IP | Modbus TCP, UDP, RTU over TCP, ASCII over TCP | Network-based protocols |
| Serial (USB-OTG) | Modbus RTU, Modbus ASCII | Direct serial communication |
| Bluetooth | Modbus RTU, Modbus ASCII | Wireless serial communication |
Network connection parameters for TCP/IP communications.
| Setting | Type | Options | Description |
|---|---|---|---|
| IP Address | Text | IPv4 address | Target device IP address |
| Port | Number | 1-65535 | TCP/UDP port number (default: 502) |
Common Port Usage: - 502 - Standard Modbus TCP port - 8888 - Alternative port for multiple devices - Custom - User-defined ports for specific applications
Serial communication parameters for USB-OTG and direct serial connections.
| Setting | Type | Options | Description |
|---|---|---|---|
| USB Port | Text | Click to Scan | Click to scan and select the available device. Clicking on the available device also checks if the permission is set correctly |
| Interface | Dropdown | Default, RS232, RS485 | Some devices have more than one interface to choose from |
| Baud Rate | Dropdown | 9600, 19200, 38400, 57600, 115200 | Serial communication speed |
| Data Bits | Dropdown | 7, 8 | Number of data bits per character |
| Parity | Dropdown | None, Even, Odd | Error detection method |
| Stop Bits | Dropdown | 1, 2 | Number of stop bits |
| Flow Control | Dropdown | None, CTS/RTS, DTR/DSR, XOFF/XON | Hardware or software flow control method |
Common Serial Configurations:
- 9600-8-N-1 - Most common industrial setup
- 19200-8-N-1 - Higher speed applications
- 38400-8-E-1 - With even parity for error checking
Bluetooth wireless communication parameters for paired devices.
| Setting | Type | Options | Description |
|---|---|---|---|
| Device | Text | 4C:3F:D3:02:DB:55 | Physical address of target Bluetooth device (e.g., Bluetooth 4.0 BLE module containing TI CC2541 chip) |
| Scan | Dialog | Click MAC address field | Click on the Device MAC address field to open scan dialog and discover available Bluetooth devices. Select preferred device to automatically fill the MAC address field |
Bluetooth Configuration Notes:
- Scan Function: Click on the MAC address field to open scan dialog and discover available Bluetooth devices
- Device Selection: Choose from discovered devices to automatically populate the MAC address field
- Auto Connection: App handles connection automatically when communication is started
- Device Pairing: Previously paired devices work best (especially older EDR devices)
- Connection Range: Typical range 10-30 feet depending on Bluetooth class
Modbus Configuration
Core Modbus parameters and data formatting options for industrial communication.
The Modbus Configuration section contains the essential parameters that define how your monitor point communicates with Modbus devices and how the received data is interpreted and displayed. This is where you configure the fundamental aspects of Modbus protocol communication including addressing, data types, byte ordering, and write operations.
Configuration Categories:
- Basic Settings - Essential Modbus parameters including addressing, slave ID, and register configuration
- Data Types - Data interpretation options and endian/byte swap configurations for proper data formatting
- Write Operations - Write function configuration and safety settings for sending data to devices
Why Modbus Configuration Matters:
- Addressing Accuracy: Proper Six-Digit addressing ensures you're reading the correct registers or coils
- Data Interpretation: Correct data type selection displays meaningful values instead of raw register data
- Byte Order Handling: Endian swap settings accommodate different manufacturer implementations
- Write Safety: Controlled write operations prevent accidental device configuration changes
- Protocol Compliance: Ensures your communication follows standard Modbus specifications
Configuration Best Practices
Start with Basic Settings to establish communication, then fine-tune Data Types for proper value display, and finally configure Write Operations only when device control is required. Each monitor point can have completely different Modbus settings, enabling multi-device monitoring from a single interface.
Essential Modbus configuration parameters.
| Setting | Type | Range/Options | Description |
|---|---|---|---|
| Name | Text | Custom text | Name to describe this Monitor Point (e.g., Oven Temperature) |
| Units | Text | Custom text | Suffix to add after value (e.g., °C) |
| Address | Number | 000001-665535 | Six-Digit Modbus (one-based) address that includes Function Code |
| Enron | Dropdown | Yes/No | Choose Yes to use Enron address and protocol layer |
| Slave ID | Number | 0-255 | Server or Slave ID of the remote Modbus server |
| Count | Number | 1-125 | Number of registers to request. Default is 1 but varies based on Data Type |
Addressing System Examples:
- Read 1st Holding Register: 400001 (4 → Function 3)
- Read 1st Input Register: 300001 (3 → Function 4)
- Read 1st Coil: 000001 (0 → Modbus Function 1)
- Read 1st Discrete Input: 100001 (1 → Modbus Function 2)
Six-Digit Addressing Guide
The address field uses Six-Digit Modbus format (one-based) that includes the Function Code. For complete address information and examples, see: quantumbitsolutions.com/address
Data interpretation and formatting options.
| Data Type | Registers | Description | Use Cases |
|---|---|---|---|
| INT16 | 1 | 16-bit signed integer | Standard counters, signed values |
| INT16U | 1 | 16-bit unsigned integer | Status values, positive counters |
| HEX | 1 | Hexadecimal display | Raw data debugging, bit patterns |
| BINARY | 1 | Binary display | Bit analysis, digital status |
| INT32 | 2 | 32-bit signed integer | Large counters, timestamps |
| FLOAT32 | 2 | IEEE 754 floating point | Analog measurements, sensors |
| DOUBLE64 | 4 | 64-bit double precision | High precision measurements |
| STRING | Variable | Text data | Device names, status messages |
| BCD | Variable | Binary Coded Decimal | Legacy system data |
| EPOCH | 2 | Unix timestamp | Time/date values |
| INT32U | 2 | 32-bit unsigned integer | Large positive values |
| INT64 | 4 | 64-bit signed integer | Very large signed values |
| INT64U | 4 | 64-bit unsigned integer | Very large unsigned values |
| Setting | Type | Range/Options | Description |
|---|---|---|---|
| Data Type | Dropdown | See table above | How to interpret register data |
| Swap | Dropdown | Byte/word swap options | Choose endian and swap configuration |
Swap Options (Endian Configuration):
| Option | Description | Use Case |
|---|---|---|
| ABCD_BE | Big Endian | Standard big endian byte order |
| BADC_BEBS | Big Endian with Byte Swap | Big endian with bytes swapped |
| DCBA_LE | Little Endian | Standard little endian byte order |
| CDAB_LEBS | Little Endian with Byte Swap | Little endian with bytes swapped |
Write operation configuration and safety settings.
| Setting | Type | Range/Options | Description |
|---|---|---|---|
| Write Function | Dropdown | See options below | Function to use for Write Operation |
| Button Write Value | Number | Custom | Preset value for "Write preset value" option in Monitor Point Management |
Write Function Options:
| Function | Code | Description | Use Case |
|---|---|---|---|
| Read Only | Default | No write operations allowed | Safe monitoring only |
| 05 Write Single Coil | 05 | Write single coil (bit) | Individual digital outputs |
| 06 Write Single Register | 06 | Write single holding register | Individual analog outputs |
| 15 Write Multiple Coils | 15 | Write multiple coils | Multiple digital outputs |
| 16 Write Multiple Registers | 16 | Write multiple holding registers | Multiple analog outputs |
| Auto | Auto | Choose based on function type and register count | Automatic selection |
Function Code Selection:
- Read Only: Default safe option, prevents accidental writes
- Single Operations: Use 05/06 for individual coil or register writes
- Multiple Operations: Use 15/16 for bulk coil or register writes
- Auto Mode: Automatically selects appropriate function based on data type and count
Write Safety
Write operations are disabled by default for safety. The preset value will be used for the "Write preset value" option in the Monitor Point Management dialog box.
Sensor Server Configuration
Android sensor integration settings for Sensor Server Mode.
The Sensor Server Configuration section enables your Android device's built-in sensors to be accessible via Modbus TCP protocol. This powerful feature automatically configures monitor points to expose real-time sensor data through standard Modbus communication, making your phone or tablet sensors available to any Modbus master device.
Cross-Reference
For complete Sensor Server operation details, setup procedures, and practical applications, see the dedicated Sensor Server Mode section.
Choose and configure Android sensors for Modbus exposure.
| Setting | Type | Options | Description |
|---|---|---|---|
| Sensor Selection | List | Pick one from available sensors | Choose Android sensor to expose via Modbus |
| Auto Configure | Automatic | Yes | Automatically sets count, protocol, data type, and register information (when sensor is clicked) |
Available Sensors (varies by device):
- Accelerometer - Device motion and orientation (X, Y, Z axes)
- Gyroscope - Angular velocity measurements (X, Y, Z axes)
- Light Sensor - Ambient light levels
- Orientation - Device position in 3D space (Azimuth, Pitch, Roll)
- Temperature - Ambient temperature (device-dependent)
- Barometer - Atmospheric pressure
- Magnetometer - Magnetic field strength (X, Y, Z axes)
- Proximity - Object detection near device
Device-Specific Sensors
The sensors listed above are examples of commonly available Android sensors. The actual sensors available in your dropdown will vary depending on your specific device hardware. Some devices may have additional specialized sensors not listed here.
Automatic Configuration:
When you select a sensor, the app automatically configures:
- Count: Set to 6 words (3 floats — 2 words each) for 3-axis sensor data
- Protocol: Set to Modbus TCP (required for sensor server mode)
- Data Type: Set to Float for proper sensor value representation
- Register Name: Updated with comprehensive sensor specifications and live readings
Sensor Server Requirements
Sensor Server mode requires Modbus Server to be enabled and active. The sensor configuration automatically optimizes settings for real-time sensor data exposure via Modbus TCP protocol.
Complete list of Android sensors available for integration.
| Sensor | Description | Data Axes | Typical Units |
|---|---|---|---|
| Accelerometer | Device motion and orientation | 3 (X, Y, Z) | m/s² |
| Gyroscope | Angular velocity measurements | 3 (X, Y, Z) | rad/s |
| Light Sensor | Ambient light levels | 1 | lux |
| Orientation | Device position in 3D space | 3 (Azimuth, Pitch, Roll) | degrees |
| Temperature | Ambient temperature | 1 | °C |
| Barometer | Atmospheric pressure | 1 | hPa |
| Magnetometer | Magnetic field strength | 3 (X, Y, Z) | µT |
| Proximity | Object detection near device | 1 | cm |
Math Configuration
Linear transformation and scaling options for data processing.
The Math Configuration section provides powerful mathematical transformation capabilities to convert raw Modbus register values into meaningful engineering units. This essential feature enables proper scaling, unit conversion, and calibration of sensor readings and industrial measurements.
Simple linear translation using y = mx + b equation.
| Setting | Type | Range | Description |
|---|---|---|---|
| Gain (m) | Number | Any decimal | Slope value in the linear equation (multiplication factor) |
| Offset (b) | Number | Any decimal | Offset value in the linear equation (addition constant) |
| Engineering Units | Text | Custom text | Display suffix (e.g., "°C", "PSI", "RPM") |
Mathematical Formula:
Use Cases: - Simple Scaling: Convert raw ADC counts to engineering units - Unit Conversion: Transform between different measurement systems - Calibration: Apply sensor-specific correction factors
Convert values from one range (PLC values) to another (real-world units).
| Setting | Type | Range | Description |
|---|---|---|---|
| Analog K1 | Number | Any decimal | Lowest value the PLC Analog module produces (e.g., 0 for 0mA) |
| Analog K2 | Number | Any decimal | Highest value the Analog module produces (e.g., 65535 for 20mA) |
| Low Limit | Number | Any decimal | Low limit of real-world unit (e.g., 0 watts) |
| High Limit | Number | Any decimal | High limit of real-world unit (e.g., 1000 watts) |
| Engineering Units | Text | Custom text | Display suffix for scaled values |
Scaling Formula:
Common scaling scenarios and practical configurations.
Linear Transformation Examples:
| Application | Gain (m) | Offset (b) | Units | Use Case |
|---|---|---|---|---|
| Temperature (°F to °C) | 0.5556 | -17.78 | °C | Convert Fahrenheit to Celsius |
| Pressure Scaling | 0.1 | 0 | PSI | Scale 0-1000 raw to 0-100 PSI |
| RPM Conversion | 2.5 | 0 | RPM | Scale encoder counts to RPM |
| Percentage | 0.1 | 0 | % | Convert 0-1000 raw to 0-100% |
Linear Scaling Examples:
| Application | K1 | K2 | Low Limit | High Limit | Units | Description |
|---|---|---|---|---|---|---|
| 4-20mA Current Loop | 0 | 65535 | 0 | 1000 | Watts | PLC analog input to power measurement |
| 0-10V Voltage Input | 0 | 32767 | -50 | 150 | °C | Analog voltage to temperature range |
| Pressure Transmitter | 819 | 16384 | 0 | 250 | PSI | 4-20mA pressure transmitter scaling |
| Flow Measurement | 0 | 65535 | 0 | 5000 | LPM | Analog flow sensor to liters per minute |
Configuration Benefits:
- Industrial Standards: Support for standard 4-20mA and 0-10V signals
- PLC Integration: Direct compatibility with PLC analog modules
- Real-World Units: Convert raw counts to meaningful measurements
- Calibration Support: Accommodate sensor-specific characteristics
Coded Messages Configuration
Translate numeric values to descriptive text messages for enhanced user interface.
Coded Messages provide a powerful way to convert numeric register values into meaningful text descriptions, making industrial data more intuitive and user-friendly. This feature is essential for displaying equipment status, alarm conditions, and operational states in human-readable format.
Configure numeric-to-text translation mappings.
| Setting | Type | Description |
|---|---|---|
| Coded Message | Dropdown | Select "None" initially, long-click for configuration menu |
| Message Mapping | Configuration | Define number-to-string translations |
Configuration Process:
- Access Configuration: Long-click on "None" when the list is empty to see additional options
- Configuration Menu: Shows Add, Change, Move UP, Move DOWN, and Remove options
- Add Messages: Click "Add" and follow prompts to define value-to-text mappings
- Organize: Use Move UP/DOWN to reorder message priority
- Maintain: Use Change/Remove to modify existing message definitions
Configuration Benefits:
- User-Friendly Display: Show meaningful text instead of raw numbers
- Status Translation: Convert numeric codes to operational status descriptions
- Alarm Indication: Highlight critical conditions with descriptive text
- Multi-Language Support: Define messages in local language or terminology
- Equipment States: Display complex operational modes in readable format
Sample message mapping configurations.
| Raw Value | Display Message | Use Case |
|---|---|---|
| 0 | "Stopped" | Equipment status |
| 1 | "Running" | Equipment status |
| 2 | "Fault" | Equipment status |
| 100-199 | "Normal Range" | Operating conditions |
| 200+ | "Over Range" | Alarm conditions |
Advanced Mappings:
- Range-based: Map value ranges to different messages
- State Machines: Define complex operational states
- Alarm Levels: Create hierarchical alarm messages
Write Operations
Write operations enable bidirectional Modbus communication, allowing you to send values to remote devices (Client Mode) or populate internal registers for remote masters to read (Server Mode). This powerful feature transforms your Android device from a read-only monitor into a full-featured industrial control interface, capable of adjusting setpoints, triggering operations, and managing device configurations.
Two Ways to Write Values:
- Write Dialog - Enter custom values through an interactive dialog for one-time changes or testing
- Write Preset Value - Instantly send pre-configured values via the Monitor Points - Preset [9f] button for quick operations
Both methods are accessible through the Monitor Point Management dialog and work in Client and Server modes.
Modbus Write Dialog
The Write Dialog box is displayed when selecting the "Write" option from the Monitor Point Management dialog (tap any monitor point to access). The dialog header shows the Monitor Point name along with the configured Data Type. Enter the value in the write field and click the Change button.

Important: The Write Dialog box is available in both Client and Server modes. During Client operation, the write value is included in the Modbus packet sent to the remote server using the selected Write Function. During Server operation, the write value is stored in internal registers where remote masters can poll and retrieve it via standard Modbus communication.
Write vs. Write Preset Value:
| Operation | Description | Access Method |
|---|---|---|
| Write | Send custom value entered in dialog | Select "Write" option from Monitor Point Management dialog |
| Write Preset Value | Send pre-configured default value | Click Monitor Points - Preset [9f] button or select "Write Preset Value" from management dialog |
Write Capabilities:
- Safety First: Write operations disabled by default to prevent accidental changes
- Dual Mode Support: Available in both Client and Server modes
- Custom Values: Enter any valid value for the configured data type
- Preset Values: Quick access to pre-configured default values
Mode-Specific Behavior:
Direct Device Communication: - Write value included in Modbus packet sent directly to remote server - Uses appropriate Modbus write function (05, 06, 15, or 16) based on data type - Immediate transmission to target device - Write confirmation received from remote device
Typical Use Cases: - Adjusting setpoints on remote controllers - Changing operational parameters - Testing device responses - Emergency shutdowns or mode changes
Internal Register Storage: - Write value stored in internal app memory/registers - Value becomes available for remote masters to poll - No immediate network transmission - Value persists until overwritten or app restart
Typical Use Cases: - Populating server registers with test data - Setting default values for client polling - Simulating device responses - Creating mock data for development/testing
Multi-Device Support: Each monitor point supports different protocols and connections, enabling write operations across multiple devices and networks simultaneously.
Safety and Configuration: - Enable Writing: Must be explicitly enabled per monitor point in configuration - Data Type Validation: Ensures entered values match configured data type - Range Checking: Validates values are within acceptable limits - Error Handling: Provides clear feedback on failed write attempts
Write Safety
Write operations are disabled by default for safety. Enable writing only for monitor points where you need to send commands or data to devices. Always verify the target device and address before enabling write operations.
Using Preset Values
Configure preset values during monitor point setup to enable quick "Write Preset Value" operations. This is especially useful for:
- Emergency stops - Quick access to safe shutdown values
- Standard setpoints - Rapid return to normal operating parameters
- Test values - Consistent test data for development and debugging
- Default configurations - Reset devices to known good states
Modbus Server Mode (Slave)
Turn your Android device into a Modbus TCP Server that other devices can poll for data. Your phone/tablet becomes a data source that remote Modbus masters can read and write using standard Modbus TCP protocol.
When to Use Server Mode
Use Server Mode when you want other devices to poll YOUR Android for data. Perfect for:
- Data Publishing: Share sensor data or calculated values with PLCs/SCADA
- System Integration: Act as a gateway between different protocols/networks
- Testing: Simulate PLC/RTU responses for development
- Multi-Reader: Allow several clients to access the same data simultaneously
- Protocol Converter: Read data from Serial/Bluetooth devices (Client mode) and expose via Modbus TCP (Server mode) - transforms non-TCP devices into network-accessible endpoints
Key Benefits:
- Multiple Clients: Handle several remote devices at once
- Standard Protocol: Industry-standard Modbus TCP (no custom drivers needed)
- Read & Write: Clients can both read values and write updates
- Easy Setup: Shared configuration with Client mode
- Gateway Capability: Run Client + Server simultaneously to bridge protocols (e.g., Serial RTU Modbus TCP)
Protocol Converter Mode
When using Client and Server modes simultaneously as a protocol converter, ensure monitor points use compatible configurations. Only certain channel/protocol combinations are supported - test your specific setup thoroughly before final deployment.
Protocol Limitation
Server mode supports Modbus TCP only. For multiple protocols, see Modbus Monitor XPF.
Quick Reference (Experts)
| Task | Location | Quick Steps |
|---|---|---|
| Enable Server Icon | Menu Settings Server | Check "Modbus Server?" |
| Set Port | Settings Server Server/Listen Port | Default: 8888 |
| Auto Start | Settings Server Auto Start | Optional auto-launch |
| Add Monitor Points | Main (+) button | Required: at least 1 point |
| Start Server | Main Server Mode [2] icon | Click to activate |
| Check Status | Server Info [8] | Shows IP, port, clients |
| Monitor Point Setup | Jump to config | Protocol: TCP, Address format |
| Write Operations | Write Operations | Pre-populate or client writes |
Setup Guide (Step-by-Step)
A. Enable Server Feature
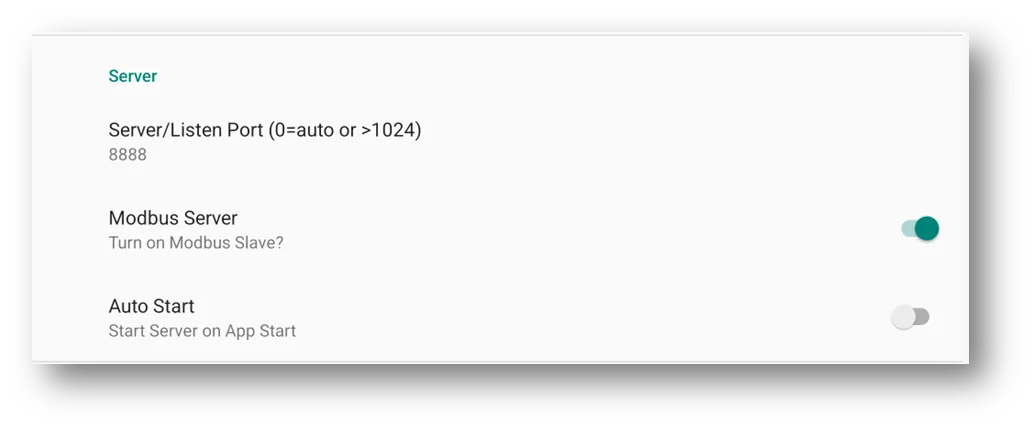
Path: Hamburger Menu → Settings → Server
These are global server configuration settings located in the main menu Settings. They apply to the entire Modbus TCP server instance and control server-wide behavior. Configure these settings once for all clients.
Settings Location Explained
Global Server Settings (configured in Hamburger Menu Settings Server):
- Modbus Server switch - Enable/disable server icon on main screen
- Server Port - Port number for ALL client connections (default: 8888)
- Auto Start - Automatically start server when app launches
Individual Monitor Point Settings (configured in Monitor Point Configuration):
- Protocol selection (Modbus TCP required for server mode)
- Register addresses and data types per point
- Data formatting and display options
- Individual point behavior
Configure These Settings:
| Setting | Recommended Value | Purpose |
|---|---|---|
| Modbus Server | On | Enables server icon on main screen for easy status/control |
| Server/Listen Port | 8888 | Port number that clients connect to (applies to ALL connections), "0" for auto-select |
| Auto Start | Optional | Automatically starts server when app launches |
Port Selection Guide
- 8888: Recommended - works on all devices (non-rooted)
- 502: Standard Modbus port (requires rooted Android)
- 1024+: Safe range for non-rooted devices
- Avoid: Port 5060 (VoIP conflicts), "0" (auto-select is unpredictable)
B. Add Monitor Points
Path: Main screen (+) button
Each monitor point defines registers that clients can access. You need at least one monitor point before starting the server.
Required Settings:
| Setting | Value | Notes |
|---|---|---|
| Protocol | Modbus TCP | Only protocol supported in server mode |
| Channel | TCP/IP (i0) | Other channels ignored |
| Address | e.g., 400001 | Register address (6-digit format) |
| Count | e.g., 10 | Number of registers (5 floats = 10 words) |
| Data Type | Float, INT16U, etc. | How data is interpreted |
Auto-Configured (ignored by server): - IP Address (uses your device IP) - Port (uses port from Settings Server)
Use 6-Digit Addressing
Addresses use Modbus protocol format (e.g., 400001 = holding register 1). See 6-Digit Addressing Guide for help.
Example - Serve 5 Float Values:
Protocol: Modbus TCP
Address: 400001   # Holding register 1
Count: 10         # 5 floats × 2 registers each
Data Type: Float
C. Start Server
Steps:
- Verify Setup: Ensure at least one monitor point is configured
- Click Server Icon: Tap Server Mode [2] button on main screen
- Check Status: Server Info [8] will show:
- Your device IP address (e.g., 192.168.1.100)
- Port number (e.g., 8888)
- Number of connected clients
Server Active
When running, remote devices can connect: modbus://your-device-ip:8888
D. Test & Monitor
How Clients Connect:
Remote Modbus masters connect using these settings:
IP Address: 192.168.1.100  (from Server Info [8])
Port: 8888                 (your configured port)
Slave ID: 1               (standard)
Register: 400001          (your monitor point address)
Count: 10                 (your monitor point count)
What Clients Can Do:
- Read: Poll monitor point values in real-time
- Write: Send values to your server (stored in memory)
- Multiple Clients: Several devices can connect simultaneously
Pre-Populate Data
Use Write Preset Value (see Monitor Point Management) to fill registers with default data before clients connect. Full details in Write Operations.
Advanced Configuration
Auto Start Feature
When to Use: Dedicated server deployments where Android runs as permanent Modbus server
Enable: Settings Server Check Auto Start
Behavior: Server starts automatically on app launch (monitor points must be pre-configured)
Port Conflicts & Best Practices
Common Port Issues:
| Port | Problem | Solution |
|---|---|---|
| < 1024 | Requires root access | Use 1024+ on non-rooted devices |
| 5060 | VoIP conflicts (audio issues) | Use 8888 or other high port |
| 0 | Auto-select causes conflicts | Pick specific port manually |
Best Practices:
- Default to port 8888 (tested and reliable)
- Document your port choice for troubleshooting
- Test port doesn't conflict with network services
- Research existing devices before selecting port
Monitor Points - Core Concept
Monitor Points are the fundamental building blocks of Modbus Monitor Advanced. Think of them as intelligent tags (similar to PLC tags) that completely define how to communicate with a specific piece of data on a Modbus device.
Figure Reference
Figure 9 shows the same main interface as Figure 1, but specifically highlights the Monitor Points [9] section where all your configured data points are displayed with live values, configuration details, and communication status.
What is a Monitor Point?
Each monitor point is a complete configuration package containing everything needed to:
- Communicate - Protocol, IP address, port, channel selection (TCP/IP, Serial, Bluetooth)
- Locate Data - Modbus address, register count, slave ID, function codes
- Display Values - Data type interpretation, scaling, engineering units
- Control Devices - Write values, preset commands, safety settings
- Transform Data - Mathematical operations, coded messages, sensor integration
The Power of Monitor Points
Multi-Device SCADA Capability: Each monitor point can use completely different protocols, IP addresses, ports, and channels. This means you can simultaneously monitor:
- A PLC via Modbus TCP on one channel
- A sensor via Serial RTU on another channel
- A controller via Bluetooth on a third channel
All from a single unified interface - true SCADA-level data collection on your mobile device!
Building Your Monitor Point List
Three Ways to Add Monitor Points:
| Method | Best For | How To |
|---|---|---|
| Manual Entry | Individual points, learning | Tap (+) button on main screen |
| Copy & Paste | Similar configurations | Use Monitor Point Management dialog |
| CSV Import | Bulk deployment (hundreds/thousands) | Hamburger Menu Import |
CSV Import Benefits: Load pre-configured monitor point lists from email attachments or the Downloads folder - perfect for deploying standardized configurations across multiple devices or sites.
Quick Configuration Reference
Essential Monitor Point Settings (see Monitor Point Configuration for details):
- Channel Settings - Choose TCP/IP, Serial, or Bluetooth
- Protocol - Select Modbus variant (TCP, RTU, ASCII)
- Connection Details - IP/port, baud rate, or Bluetooth MAC
- Basic Settings - Name, address, slave ID, register count
- Data Types - INT16, FLOAT32, STRING, etc.
- Write Operations - Read-only vs write-enabled
- Math Configuration - Linear scaling, gain/offset
- Coded Messages - Number-to-text translation
- Sensor Server - Android sensor integration
Monitor Point Management
The Monitor Point Management Dialog is your central control hub for managing individual monitor points. This dialog provides quick access to all configuration, modification, and control operations for the selected monitor point.
How to Open the Management Dialog
Quick Access Methods:
- Direct Tap: Touch any monitor point in the main list 9
- Swipe Left: Swipe left on a monitor point to expose the menu button, then tap it
The dialog appears immediately, displaying all available management options as radio buttons.
Available Management Options
| Option | Description | When to Use |
|---|---|---|
| Communications | Toggle communication on/off for this point | Temporarily pause polling without deleting the configuration |
| Add | Create a new monitor point with default settings | Add another device or register to your monitoring list |
| Remove | Permanently delete this monitor point | Clean up unused or obsolete monitor points |
| Change | Open full configuration dialog | Modify any setting: Address, Data Type, Channel, Protocol, etc. - see Monitor Point Configuration |
| Copy | Copy all settings to clipboard | Backup configuration or prepare to duplicate similar points |
| Paste | Create new point from copied settings | Quickly duplicate similar configurations with minor variations |
| Write | Send custom value to device | Enter specific value to write - opens dialog for input (see Write Operations) |
| Write Preset Value | Send pre-configured default value | Instantly write the preset value configured in point settings |
| Hide/Unhide Configuration | Toggle visibility of technical details | Clean up interface by hiding 9c, 9d, 9e configuration lines |
| Apply Settings to All | Copy communication settings to all points | ⚠️ Bulk update IP/port/channel - use with extreme caution |
Using the Management Dialog
Simple 3-Step Process:
- Select: Tap the radio button next to your desired action
- Execute: Press OK to perform the action
- Cancel: Press Cancel to exit without changes
Quick Configuration Workflow
- First Time Setup: Use Change to configure all settings
- Duplicate Points: Use Copy → Paste → Change to modify specifics
- Ongoing Use: Use Write or Write Preset Value for value changes
Key Features & Capabilities
Smart Interface Adaptation
The configuration dialog automatically adapts its view based on complexity:
- Simple View: Shows only essential settings for basic monitor points
- Advanced View: Expands to show all options when complex features are configured (Math, Coded Messages, Sensor Server)
Bulk Operations
The "Apply Settings to All" option propagates communication settings from the selected point to all other monitor points in your list:
- What Gets Copied: Channel, Protocol, IP Address, Port, Connection settings
- What Stays Unique: Name, Address, Slave ID, Data Type, Count
- Warning: This affects ALL monitor points - use carefully in multi-device scenarios
Common Issues & Solutions
| Issue | Cause | Solution |
|---|---|---|
| Error notifications (e.g., "Error 343235") | Configuration invalid or driver busy | Wait a few seconds and retry the operation |
| Write commands fail | Write capability not enabled | Use Change → Modbus Configuration → Enable write function |
| Write to Input Registers fails | Register type is read-only | Verify you're writing to Holding Registers (400001+), not Input Registers (300001+) |
| Paste doesn't work | No configuration in clipboard | Select a point and use Copy first |
| Apply Settings to All affects wrong points | Applied to all without distinction | Manually configure each point, or group similar devices and apply selectively |
Best Practices for Monitor Point Management
Configuration Safety:
- Always Copy important configurations before making major changes
- Test write operations on non-critical devices first
- Use descriptive names that identify device, location, and data type
Efficiency Tips:
- Configure one point completely, then Copy → Paste → Change specific fields for similar devices
- Group related monitor points together in the list for easier management
- Use Hide/Unhide Configuration to reduce screen clutter once points are configured
Write Operations:
- Both Write and Write Preset Value work in Client Mode (sends to remote device) and Server Mode (stores in internal registers)
- Configure preset values for frequently used settings (emergency stops, default setpoints)
- See Write Operations for complete write functionality details
Sensor Server Mode
Sensor Server is an innovative extension of the Modbus Server that exposes your Android device's built-in sensors through the Modbus TCP protocol.
Configuration Details
For detailed sensor selection and configuration options, see the Sensor Server Configuration section in the Monitor Point Configuration guide.
What is Sensor Server?
Core Concept
- Hardware Integration: Links Android sensors directly to Modbus registers
- No Programming Required: Any Modbus TCP Master can access phone sensors
- Automatic Configuration: Sensor selection automatically configures register settings
- Real-time Data: Live sensor readings available via standard Modbus polling
Available Sensors
Common Android Sensors:
- Accelerometer: Device motion and orientation
- Gyroscope: Angular velocity measurements
- Light Sensor: Ambient light levels
- Orientation: Device position in 3D space
- Temperature: Ambient temperature (device-dependent)
- Barometer: Atmospheric pressure
- Magnetometer: Magnetic field strength
- Proximity: Object detection near device
Configuring Sensor Server
Quick Setup (5 Steps)
- Enable Server Mode - Turn on Modbus Server in Settings → Server
- Add Monitor Point - Tap (+) button on main screen
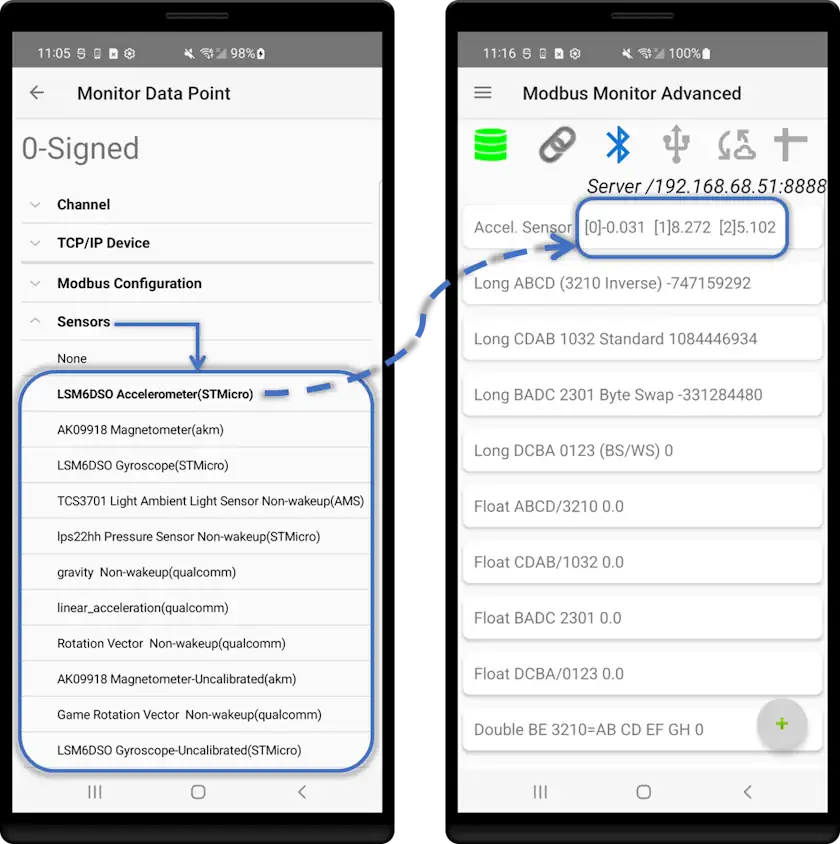
- Select Sensor - Choose sensor from dropdown (e.g., Accelerometer)
- Verify Auto-Config - App automatically sets all Modbus parameters
- Start Server - Tap Server Mode icon [2] to begin
Automatic Configuration
When you select a sensor, the app automatically configures:
- Protocol: Modbus TCP
- Data Type: Float (32-bit IEEE 754)
- Count: 6 registers (3 float values × 2 registers each)
- Register Name: Live sensor specifications and readings
Understanding Sensor Data Format
Scalar Array Structure: Sensor values are exposed as arrays in consecutive Modbus registers.
Example - Accelerometer Reading:
| Array Index | Axis | Value | Register Address | Purpose |
|---|---|---|---|---|
| [0] -0.031 | X | -0.031 m/s² | 400001-400002 | Lateral motion (left/right) |
| [1] 8.272 | Y | 8.272 m/s² | 400003-400004 | Longitudinal motion (forward/back) |
| [2] 5.102 | Z | 5.102 m/s² | 400005-400006 | Vertical motion (up/down) |
Key Points
- Each float value occupies 2 consecutive registers (32-bit format)
- Remote clients read starting at the configured address (e.g., 400001)
- Number of array elements varies by sensor type (1-axis to 3-axis)
- Readings update in real-time as sensor values change
Sensor Information Display
The register name field shows comprehensive sensor specifications automatically:
Sensor #[ID] [SensorName]
Power:[mA] Resolution:[value] Range:[max]
Vendor:[manufacturer] Version:[number]
Raw Data: [0]xxx.xx [1]xxx.xx [2]xxx.xx
What Each Field Means:
- Sensor ID: Android system identifier
- Power: Current consumption (mA)
- Resolution: Measurement precision
- Range: Maximum measurable value
- Vendor: Hardware manufacturer
- Version: Sensor driver version
- Raw Data: Live readings updated in real-time
Configuration Requirements
Minimum Settings (auto-configured when sensor selected):
| Setting | Required Value | Notes |
|---|---|---|
| Sensor Selection | Choose from the List | Varies by device hardware |
| Address | 6-digit format (e.g., 400001) | Starting register for data |
| Count | 6 minimum | 3 floats × 2 registers each |
| Protocol | Modbus TCP | Server mode requirement |
| Data Type | Float | 32-bit IEEE 754 format |
Device-Specific Sensors
Available sensors depend on your device hardware. Common sensors: Accelerometer, Gyroscope, Magnetometer, Light, Barometer, Temperature, Proximity. Check your device specifications for exact sensor list.
Common Use Cases
| Application | Sensor Used | Description |
|---|---|---|
| Vibration Monitoring | Accelerometer | Monitor equipment vibration patterns for predictive maintenance |
| Environmental Data | Temperature, Barometer, Light | Collect ambient conditions for HVAC or industrial processes |
| Motion Detection | Proximity, Accelerometer | Security systems and automated access control |
| Equipment Orientation | Orientation, Magnetometer | Track device position and alignment in 3D space |
| Light Automation | Light Sensor | Automatic lighting control based on ambient levels |
| Prototype Testing | Any sensor | Quick sensor integration without custom programming |
Learn More
For detailed sensor specifications, data formats, and best practices, see: Android Sensors Overview
Sensor Server TL;DR
- Enable Modbus Server (Settings → Server).
- Add monitor point → Channel: TCP/IP → Protocol: Modbus TCP.
- Select sensor (auto‑config sets Count=6, Data Type=Float for 3‑axis).
- Set starting Address (e.g. 400001) → OK.
- Start Server → Remote master reads 400001 Count=6 (3 floats).
- Need to publish sensor values? See Cloud Publishing FAQ.
Multi-Sensor Configuration
You can expose multiple sensors simultaneously. Use one monitor point per sensor; space addresses to avoid overlap.
| Sensor | Start Address | Registers | Notes |
|---|---|---|---|
| Accelerometer | 400001 | 6 | X,Y,Z acceleration (m/s²) |
| Gyroscope | 400007 | 6 | X,Y,Z angular velocity (rad/s) |
| Light | 400013 | 2 | Ambient illumination (lux) |
| Magnetometer | 400015 | 6 | Magnetic field (µT) |
| Barometer | 400021 | 2 | Atmospheric pressure (hPa) |
| Temperature | 400023 | 2 | Ambient temperature (°C) |
Address spacing rule: allocate 2 registers per float. Three‑axis sensors: 6 registers; single‑axis: 2.
Vibration Monitoring Workflow
| Axis | Register Range | Meaning |
|---|---|---|
| X | 400001-400002 | Lateral motion |
| Y | 400003-400004 | Longitudinal motion |
| Z | 400005-400006 | Vertical motion |
Steps: 1. Rigidly mount device to equipment. 2. Expose accelerometer (auto Count=6). 3. SCADA polls 400001 Count=6. 4. Apply threshold rules to detect abnormal vibration.
Sensor Capability Reference
| Sensor | Data | Units | Example Uses |
|---|---|---|---|
| Accelerometer | 3-axis acceleration | m/s² | Vibration, motion |
| Gyroscope | 3-axis angular velocity | rad/s | Rotation, stability |
| Light | Illumination level | lux | Lighting automation |
| Orientation | Device orientation angles | degrees | Alignment tracking |
| Magnetometer | 3-axis magnetic field | µT | Compass, metal detection |
| Proximity | Distance / presence | cm | Object / access sensing |
| Temperature | Ambient temperature | °C | Environmental logging |
| Barometer | Atmospheric pressure | hPa | Weather / altitude |
Best Practices
Power: keep device powered • disable battery optimization • use Auto Start for unattended operation.
Accuracy: calibrate if supported • allow stabilization • secure mounting.
Interpretation: confirm expected units • validate under known conditions • review datasheets.
Network: prefer stable Wi‑Fi/Ethernet • consider static IP • monitor client count.
Troubleshooting
| Problem | Cause | Resolution |
|---|---|---|
| No sensors listed | Hardware absent | Use device with required sensors |
| All zeros | Permissions/sensor inactive | Restart app; verify sensor availability |
| Erratic readings | Device movement / mounting | Improve mounting; add damping |
| Client cannot read | Server not started / network | Start server; verify IP/port/firewall |
| Wrong data format | Client expects integers | Read 6 registers as 3 floats |
Practical Guides
Now that you understand the interface, settings, and monitor point configuration details, this section provides step-by-step guides for the two main active modes: Client (Master) and Server (Slave). For publishing Android sensors, see the consolidated Sensor Server Mode section above.
Guide 1: Using Modbus Client Mode (Master)
What is Client Mode? In Client (Master) Mode, your Android device polls remote Modbus devices (servers/slaves) to retrieve data and optionally write values back to them. This is the most common use case for monitoring PLCs, sensors, meters, and other industrial equipment. In this guide we configure three monitoring points—each on a different channel (1. TCP/IP, 2. USB Serial, 3. Bluetooth BLE using an HM‑10 module)—to demonstrate simultaneous multi‑channel communication.
Prerequisites
Before starting, ensure you have:
- Network Access: Wi-Fi/Ethernet connection to your Modbus device OR USB-OTG adapter for serial connections
- Device Information: IP address/port (TCP) or baud rate/settings (serial)
- Register Details: Modbus addresses you want to monitor
- Protocol Knowledge: Whether device uses Modbus TCP, RTU, or ASCII
Quick Start: Monitoring Your First Device
Step 1: Add a Monitor Point
- Tap the + button [11] on the main screen
- A new monitor point appears with default settings
- Tap the monitor point to open Monitor Point Management dialog
- Select "Change" to edit configuration
Step 2: Configure Communication Channel
Expand the Channel Settings section:
Standard network connection over Wi-Fi/Ethernet to a PLC, gateway, or Modbus TCP device.
- Channel: Select
TCP/IP - Protocol:
Modbus TCP - IP Address: Enter device IP (e.g.,
192.168.1.100) - Port: Device Modbus port (default:
502) - Slave ID: Some TCP devices still require a unit ID (often
1)
Direct wired connection using a USB-OTG serial adapter (RS-485/RS-232).
- Channel: Select
Serial - USB Port: Choose adapter from dropdown (appears when plugged in)
- Interface: Leave
Defaultunless special hardware requires change - Baud Rate: Match device (e.g.,
9600,19200,38400) - Data Bits: Usually
8 - Parity:
None(common) or as required (Even/Odd) - Stop Bits: Usually
1 - Flow Control:
None(most Modbus devices) - Protocol:
Modbus RTU(most common) orModbus ASCII - Slave ID: Device station number (1–247)
Typical Serial Connection
USB Serial Compatibility
Use adapters with FTDI FT232/FT4232, Prolific PL2303, Silicon Labs CP210x, or CH340/CH341 chipsets for best compatibility.
Wireless serial bridge using a BLE/Classic module (e.g., HM-10) to a Modbus RTU device.
- Channel: Select
Bluetooth - Device: Choose paired module (e.g.,
HM-10 4C:3F:D3:02:XX:XX) - Protocol:
Modbus RTU(ASCII if device requires)
Typical Bluetooth Connection
Pairing Requirement
Pair the Bluetooth module in Android system settings first; then it appears in the selection list.
Step 3: Configure Modbus Parameters
Expand the Modbus Configuration section:
- Name: Give it a descriptive name (e.g.,
Tank Level,Motor Speed) - Slave ID: Enter your device's Modbus slave ID (usually
1-247) - Address: Enter the 6-digit Modbus address (see 6-Digit Addressing Guide)
- Examples:
400001(holding register 1),300001(input register 1),100001(coil 1) - Count: Number of registers to read
1for single 16-bit integer2for 32-bit float or long integer4for 64-bit double
- Data Type: Select how to interpret the data
16-bit Integer,32-bit Float,Boolean, etc.- See Data Types tab for complete list of available types
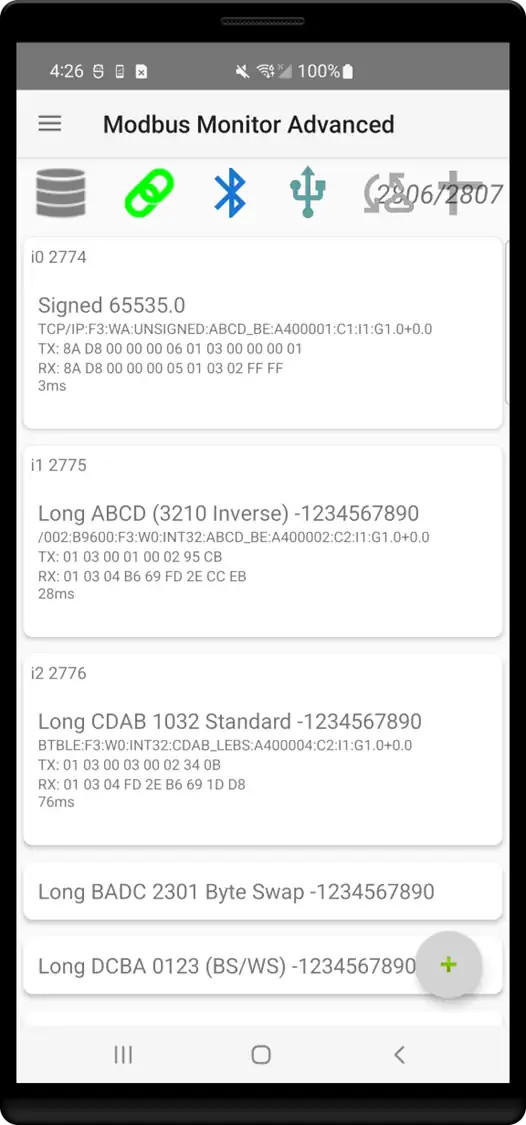
Example Per-Channel Modbus Configuration
The index labels (i0, i1, i2) identify the sample monitor points for each communication channel shown in the figure. Below are complete example configurations you can adapt; replace addresses/counts with those for your devices.
Channel: Serial Port
USB Port: /dev/bus/usb/001/002
Interface: Default (Hardware Set)
Baud Rate: 9600
Data Bits: 8
Parity: None
Stop Bits: 1
Flow Control: None
Protocol: Modbus RTU
Name: Long ABCD (3210 Inverser)
Units: <empty>
Address: 400002        # Holding register 2
Slave ID: 1
Count: 2               # 32-bit Integer
Data Type: INT32
Write Function: Read Only
Swap: ABCD_BE          # Big endian
Write Preset Value: None
Address Format
This app uses the 6-digit Modbus Protocol format, not PLC addressing. The 6-digit format combines function code and address:
000001-009999: Coils (Function 1)100001-199999: Discrete Inputs (Function 2)300001-365535: Input Registers (Function 4)400001-465535: Holding Registers (Function 3)
See the 6-Digit Addressing Guide for complete details and conversion tools.
Step 4: Start Polling
- Tap OK to save your configuration
- Tap the Client Mode icon [3] to start polling
- Icon turns green (chain link) when active
- Your monitor point now shows live data values
Expected Results:
- Numbers displayed: Successfully reading from device
- "?????" displayed: Communication failure - check settings
- Packet counters: Good/Bad counters show communication health
Writing Values to Remote Devices
Once your monitor point is configured and reading successfully, you can write values back to the device:
Enable Write Capability:
- Tap monitor point "Change"
- Expand Modbus Configuration scroll to Write Operations tab
- Write Function: Select appropriate function (already set in during Modbus Monitoring Configuration)
Write Single Coil (05)for boolean valuesWrite Single Register (06)for single registersWrite Multiple Registers (16)for multiple registers- (Optional) Button Write Value: Set a preset value for quick writes
- Tap OK to save
Two Ways to Write:
- Custom Value Write:
- Tap monitor point "Write"
- Enter value in dialog
-
Tap "Change" to send
-
Preset Value Write (faster):
- Tap monitor point "Write Preset Value"
- Instantly sends pre-configured value
Write Safety
Write operations are disabled by default to prevent accidents. Always test writes on non-critical systems first.
For complete write operation details, see the Write Operations section.
Advanced Client Mode Features
Multiple Device Monitoring: Add multiple monitor points with different IP addresses, ports, protocols, and channels. Each point operates independently.
Polling Optimization:
- Interval: Set in Settings Timing (default: 1000ms)
- Timeout: Adjust if devices are slow to respond
- Retries: Configure retry attempts for failed communications
Data Scaling and Transformation:
- Use Math Linear Transformation to scale raw values
- Apply Coded Messages to translate numbers to text
Cloud Integration: Enable real-time data logging to Google Sheets, ThingSpeak, or MQTT brokers (requires add-ons). Data is sent to the cloud after each complete monitoring loop through all configured points.
Troubleshooting Client Mode
| Problem | Solution |
|---|---|
| "?????" values | Check IP address, port, slave ID, and network connectivity |
| Timeouts | Increase timeout in Settings Timing, verify device is online |
| Wrong values | Verify address format (6-digit), data type, and byte order |
| No USB device | Check USB-OTG support, adapter compatibility, USB permissions |
| Write failures | Ensure write capability is enabled, correct write function selected |
Guide 2: Modbus Server Mode (Slave)
Goal: Make your Android device readable by other Modbus TCP masters in under 5 minutes.
Server Mode Basics: Your device answers Modbus TCP requests. Remote systems poll the register values you expose (and can write if enabled). Full theory is in the earlier Modbus Server Mode section—this guide is the fast, beginner walkthrough.
1. When to Use
| Use Case | Purpose |
|---|---|
| Testing | Simulate a Modbus device for SCADA / PLC validation |
| Sensor Publishing | Share phone sensor data (see Sensor Server Mode) |
| Protocol Bridge | Combine Client + Server to relay serial/Bluetooth data as TCP |
| Demo / Training | Provide live registers for classroom or lab exercises |
2. Minimum Requirements
- Wi‑Fi/Ethernet connection
- One monitor point (at least) with Protocol = Modbus TCP
- Open port (use
8888if502blocked/non‑root)
3. Quick Start (Essential Steps)
- Menu → Settings → Server → Enable “Modbus Server?” (icon [2] appears)
- Set Port:
8888(safe default). Leave Auto Start off for now. - Tap (+) to add a monitor point → tap it → Change.
- Channel: TCP/IP | Protocol: Modbus TCP.
- Address:
400001| Count:2(example float) | Data Type: FLOAT32 | Slave ID:1. - OK → Tap Server icon [2] → Icon turns green → Note IP & Port.
- Test from a PC Modbus client reading 400001 Count=2 (should return a value or 0 if not written yet).
4. Minimal Configuration Reference
| Field | Example | Why It Matters |
|---|---|---|
| Port | 8888 | Accessible without root; avoids common conflicts |
| Channel | TCP/IP | Required for Server Mode |
| Protocol | Modbus TCP | Only protocol served |
| Address | 400001 | First holding register (6‑digit format) |
| Count | 2 | Size for one 32‑bit float (2 × 16‑bit registers) |
| Data Type | FLOAT32 | Defines value interpretation |
| Slave ID | 1 | Unit ID some clients still send |
| Write Function | Read Only (start) | Prevent accidental writes |
5. Example Register Map (Small Demo)
| Point | Name | Address | Count | Data Type | Purpose |
|---|---|---|---|---|---|
| 1 | TankLevel | 400001 | 2 | FLOAT32 | Simulated level value |
| 2 | MotorSpeed | 400003 | 2 | FLOAT32 | Simulated RPM |
| 3 | StatusFlag | 400005 | 1 | INT16U | Bit/flag status |
Spacing keeps floats aligned (each float = 2 registers). Adjust addresses as needed; they must not overlap.
6. Writing Data (Optional)
To serve a non‑zero value: tap monitor point → Write → enter value → Change. Or set a preset: Change → Write Operations tab → Button Write Value → OK → Use “Write Preset Value”. Remote clients then read updated registers.
7. Testing From a PC
| Step | Action |
|---|---|
| 1 | Open QModMaster / ModScan / pymodbus script |
| 2 | Enter IP (shown near Server icon) & Port (e.g., 8888) |
| 3 | Function: Read Holding Registers (FC3) |
| 4 | Start Address: 400001 |
| 5 | Confirm value (0 or written float). Write test value and re‑read. |
If Address field requires “raw” number, subtract 400000 (e.g., 1) depending on client addressing style.
8. Optional Enhancements
- Enable Auto Start for dedicated gateways.
- Add Sensor Server monitor points for live accelerometer data.
- Use Copy/Paste to bulk duplicate similar registers.
- Pre‑populate values with Preset for predictable startup diagnostics.
9. Troubleshooting (Fast Table)
For detailed error code explanations and solutions, see the :octicons-alert-circle: Error Codes & Troubleshooting Guide. | Problem | Likely Cause | Fix | |---------|--------------|-----| | Client timeout | Wrong IP/Port or firewall | Verify IP; try port 8888; check router rules | | Reads always 0 | No write performed / wrong address | Write a test value; confirm address matches 6‑digit format | | Client shows illegal function | Using non‑TCP protocol | Ensure monitor point Protocol = Modbus TCP | | Value length mismatch | Count incorrect | Set Count=2 for 32‑bit float, 1 for INT16 | | Cannot use port 502 | Non‑root Android restriction | Use 8888 or any >1024 | | Writes ignored | Write Function set to Read Only | Change Write Function, then retry | | Random disconnects | Power saving / sleep | Disable Battery Saver or keep device awake |
10. Safety & Good Practice
| Tip | Reason |
|---|---|
| Start Read Only | Prevent unintended device control |
| Document register map | Helps remote users avoid overlap/misuse |
| Separate test vs production ports | Avoid accidental polling on live systems |
| Avoid exposing sensitive data | No authentication built‑in; stay on trusted networks |
11. Next Steps
- Need more detail? See full Modbus Server Mode section.
- Want to publish sensor values? Jump to Sensor Server Mode.
- Ready for bidirectional control? Review Write Operations.
Step 4: Populate Registers with Data
Server mode stores data in internal memory. You have two options:
- Tap monitor point "Write"
- Enter value
- Tap "Change" to store in register
- Value is now available for remote clients to read
- Tap monitor point "Change"
- In Modbus Configuration Write Operations tab
- Set "Button Write Value" to your default value
- Tap OK to save
- Tap monitor point "Write Preset Value" to load default
Step 5: Start the Server
- Tap the Server Mode icon [2]
- Icon turns green when server is running
- Main screen shows Server IP Address and Port
- Remote clients can now connect and poll your device
Verify Server is Running:
- Server icon is green
- IP address and port displayed on main screen
- Use another Modbus client to test connection
Understanding Server Data Flow
- Configuration: You set up monitor points with addresses and data types
- Data Storage: Values are written to internal memory at specified addresses
- Client Request: Remote master sends Modbus read request
- Response: App retrieves value from memory and responds to client
- Write Support: Clients can also write values to your server (if enabled)
For detailed explanation, see How Server Mode Works.
Testing Your Server
Use Another Modbus Client to Test:
- On a computer on the same network, use Modbus client software
- Connect to your Android device's IP address and configured port
- Read the register addresses you configured
- You should see the values you wrote
Common Test Tools:
- Modbus Monitor XPF (Windows)
- QModMaster (Cross-platform)
- ModScan (Windows)
- Python modbus-tk or pymodbus (Programming)
Server Mode Best Practices
Register Organization:
- Use logical address ranges for different data types
- Document your register map for remote clients
- Reserve address ranges for future expansion
Performance Optimization:
- Don't create more monitor points than you need
- Group related data in consecutive registers
- Set appropriate polling intervals for your application
Security Considerations:
- Server has no authentication - use on trusted networks only
- Consider firewall rules to restrict access
- Use non-standard ports for additional obscurity
- Monitor connection activity
Troubleshooting Server Mode
| Problem | Solution |
|---|---|
| Can't connect to server | Verify IP address, check firewall settings, ensure server is started |
| Port already in use | Change to different port in Settings, check for other apps using port |
| Clients read wrong values | Verify address format matches client expectations, check data type |
| Write operations fail | Enable write capability in monitor point configuration |
| Server stops unexpectedly | Check Android battery optimization settings, disable power saving |
Add-Ons Integration
Modbus Monitor Advanced can be extended with cloud integration add-ons that enable real-time data logging, IoT dashboards, and remote monitoring capabilities. This section covers the three available add-ons.
Add-On Purchase Required
The following features require separate add-on purchases from the app or quantumbitsolutions.com. Configuration options appear in Settings after purchase.
MQTT Integration
MQTT (Message Queuing Telemetry Transport) is a lightweight publish/subscribe messaging protocol ideal for IoT applications. The MQTT add-on allows Modbus Monitor Advanced to publish monitor point data to any MQTT broker.
Minimal Setup:
1. Broker: enter host & port (e.g., broker.hivemq.com:1883).
2. Client ID: unique per device (e.g., android01).
3. Credentials: add username/password if broker requires.
4. Base Topic: e.g., modbus/android01; app appends point/topic segments.
5. Start polling; confirm single value publish; optionally enable batch JSON topic.
Quick Access: Configure in Settings MQTT
ThingSpeak Integration
ThingSpeak is a cloud-based IoT analytics platform that provides instant visualizations, MATLAB analytics, and data export capabilities.
Minimal Setup: 1. Create channel; copy Write API Key. 2. Ensure ≤8 needed points; ordering maps to fields 1–8. 3. Set interval ≥15 s (free tier enforced limit). 4. Enable add-on; start polling; verify chart updates. 5. Add field names & units in ThingSpeak UI for clarity.
Quick Access: Configure in Settings ThingSpeak
Google Sheets Integration
Google Sheets integration enables automatic real-time data logging to cloud spreadsheets, perfect for data collection, reporting, and sharing.
Minimal Setup: 1. Spreadsheet: capture ID from URL & sheet (tab) name. 2. Authenticate once in app (stores token). 3. Enable append mode (timestamp + ordered point values). 4. Start polling; confirm rows append; adjust interval if quota pressure. 5. Periodically archive/export large historical sheets.
Quick Access: Configure in Settings Google Sheets
Feature Summary
| Add-On | Key Features | Best For |
|---|---|---|
| 📊 Google Sheets | Real-time data publishing, automated reports, cloud storage | Data logging, sharing with teams, Excel-compatible exports |
| ☁️ ThingSpeak | IoT dashboards, API access, alerts and triggers, MATLAB analytics | Visualization, public data sharing, advanced analytics |
| 📡 MQTT | Industrial IoT integration, AWS/Azure/Google Cloud, pub/sub messaging | Enterprise systems, real-time streaming, distributed architectures |
Cloud Publishing FAQ
Use these FAQs to understand how locally collected data (Bluetooth, Serial, TCP/IP) is forwarded to remote cloud services (MQTT, Google Sheets, ThingSpeak).
How does local data reach the cloud?
After each complete polling cycle (Client Mode) or after internal register updates (Server/Sensor Server), the app aggregates current monitor point values and triggers publishing routines for any enabled add-ons. Each add-on uses its own transport (HTTPS for Sheets/ThingSpeak, MQTT protocol for brokers).
Do Bluetooth and Serial data publish the same as TCP/IP data?
Yes. Channel type is abstracted at the monitor point layer. Once a value is updated (Bluetooth, Serial RTU/ASCII, TCP/IP), it is treated uniformly for cloud publishing. Failed reads (displayed as ?????) are skipped or sent as blank (configurable in future versions).
What is a good update interval for cloud publishing?
Recommended polling interval: 1000–3000 ms for stable industrial devices. For Google Sheets use ≥5 s to avoid quota pressure; ThingSpeak free tier enforces 15 s minimum per channel; MQTT can handle high frequency but practical field deployments usually stay at 1–2 s unless streaming fast-changing data.
How are Google Sheets columns mapped?
Each monitor point becomes a row append or a column update depending on configuration (planned enhancement). Present implementation appends a timestamp plus sequential monitor point values in fixed order. Name and Units help downstream identification—use descriptive Names.
How do I handle ThingSpeak's 8-field limit?
Select up to 8 critical monitor points or aggregate related values into scaled/combined fields using Math Configuration. Create multiple channels if you need >8 distinct values; document mapping externally for traceability.
What MQTT topic structure should I use?
Suggested pattern:
Example:modbus/android01/TankLevel/400001. For grouped payloads publish JSON on modbus/<deviceId>/batch containing an array of {name,address,value,units,timestamp} objects. Use QoS 1 for reliability; QoS 0 for fastest throughput; retain only configuration topics, not live telemetry.
Example batch JSON payload:
```json
{
    "deviceId": "android01",
    "timestamp": "2025-11-25T14:03:00Z",
    "points": [
        {"name": "TankLevel", "address": 400001, "value": 73.42, "units": "%"},
        {"name": "MotorSpeed", "address": 400003, "value": 1450, "units": "RPM"},
        {"name": "AccelX", "address": 400101, "value": -0.031, "units": "m/s²"}
    ]
}
```
Can I publish Sensor Server values to MQTT?
Yes—sensor-backed monitor points are just float values in registers. Once enabled, their current array elements are published like any other point. Consider a prefix sensor/ or an additional attribute in JSON payload for differentiation.
What happens if the network drops?
MQTT: Messages fail and are retried automatically if the session can reconnect; offline periods lose non-retained telemetry. Google Sheets / ThingSpeak: HTTP post fails silently; data is not cached for replay. For critical reliability consider an external buffering gateway or future app buffering feature.
Security considerations?
- Use TLS-enabled MQTT brokers (port 8883) where possible.
- Avoid publishing sensitive data to public ThingSpeak channels.
- Limit Google Sheets sharing permissions; treat spreadsheet URL as semi-sensitive.
- Keep Android device on trusted Wi‑Fi; avoid open networks for write-enabled points.
How do I reduce data usage?
Increase polling interval, publish only changing values (future delta mode), aggregate multiple points into a single MQTT JSON payload, and disable unused add-ons. Use Math/Scaling to condense data (e.g., packing status bits into one INT16 field).
Troubleshooting: No data appears in cloud?
| Symptom | Likely Cause | Action |
|---|---|---|
| Empty rows in Google Sheets | Spreadsheet ID or auth missing | Re-enter credentials; verify sheet exists |
| ThingSpeak update refused | Interval below 15 s limit | Increase delay to ≥15 s; check API key |
| MQTT broker disconnects | Wrong host/port or TLS mismatch | Verify broker settings; test with an external MQTT client |
Values are ????? locally |
Communication failure upstream | Fix channel/protocol config; publishing skips invalid values |
| High data costs | Polling interval too low | Raise interval; batch MQTT messages |
Choosing between MQTT, ThingSpeak, Google Sheets?
| Need | Best Choice | Why |
|---|---|---|
| Real-time streaming & integration | MQTT | Low latency, flexible topics, enterprise brokers |
| Simple dashboard + public sharing | ThingSpeak | Built-in charts, MATLAB analytics, easy API |
| Spreadsheet logging & reporting | Google Sheets | Familiar interface, export to CSV/Excel |
| Hybrid (live + archival) | MQTT + Sheets | Stream critical data; log periodic summaries |
Best Practice Summary
Poll locally at a stable interval (1–2 s), publish only required points, use descriptive names, apply scaling/units, test each add-on individually, then enable combined publishing. Document field/topic mapping for maintainability.
Professional Use Cases
Field Service Applications
- Equipment Diagnostics: Quick troubleshooting of industrial devices
- Configuration Backup: Save and restore device settings
- Performance Monitoring: Track system performance over time
- Communication Testing: Verify network connectivity and protocols
System Integration
- Device Commissioning: Validate new installations
- Network Mapping: Document system architectures
- Protocol Verification: Test custom implementations
- Performance Optimization: Identify communication bottlenecks
Research & Development
- Protocol Analysis: Reverse engineer device communications
- Custom Development: Test new device implementations
- Educational Demos: Teach Modbus fundamentals
- Communication Studies: Analyze traffic patterns
Advanced Configuration Examples
TCP/IP Network Setup
Device Configuration:
  Channel: TCP/IP
  Protocol: Modbus TCP
  IP Address: 192.168.1.100
  Port: 502
  Slave ID: 1
  Address: 400001 (holding register 1)
  Count: 1
  Data Type: 16-bit Integer
Serial/USB Configuration
Serial Connection:
  Channel: Serial
  Protocol: Modbus RTU
  Baud Rate: 9600
  Data Bits: 8
  Parity: None
  Stop Bits: 1
  Slave ID: 1
  Address: 300001 (input register 1)
  Count: 2 (for 32-bit float)
Multi-Device Monitoring
Device 1 - PLC:
  TCP/IP  192.168.1.10:502
Device 2 - HMI:
  TCP/IP  192.168.1.20:503
Device 3 - Sensor:
  Serial  USB-OTG @ 19200 baud
Hardware Requirements
Mobile Device Specifications
- Android OS: 8.0 (API 26) or higher
- RAM: 2GB minimum, 4GB recommended
- Storage: 100MB available space
- Network: Wi-Fi, 4G/5G for TCP/IP communication
- USB: OTG support for serial connections
Serial Communication Hardware
- USB-OTG Adapter: For connecting serial devices
- USB-to-RS485 Converter: For industrial networks
- Proper Grounding: Essential for reliable communication
- Quality Cables: Use shielded cables in industrial environments
Hardware & Cloud Integration
USB Serial Requirements
Recommended Chipsets: FTDI FT232/FT4232, Prolific PL2303, Silicon Labs CP210x, CH340/CH341 Hardware: USB-OTG adapter, USB-to-RS485 converter for industrial networks
Troubleshooting
Common Issues
Communication Problems: - "?????" Values - Unable to collect data from remote servers - Check IP address, port, and protocol settings - Verify network connectivity and device accessibility - Confirm correct Channel/Protocol combinations - Protocol Errors - Ensure correct Channel/Protocol combinations (see compatibility table in Client Mode section) - Timeouts - Increase timeout values in Settings Timing
Hardware Issues: - USB Issues - Verify OTG adapter compatibility and USB permissions - Ensure Android device supports USB-OTG - Check that USB serial adapter uses supported chipset (FTDI, Prolific, etc.) - Grant USB permissions when prompted - Bluetooth Connection - Verify Bluetooth pairing and permissions - Network Connection - Check Wi-Fi/Ethernet connectivity for TCP/IP mode
Configuration Issues:
- Invalid Addresses - Use 6-digit Modbus Protocol format, not PLC addressing
- Wrong Register Count - Set correct count for data type (1 for integers, 2 for floats)
- Write Failures - Enable write permissions for each monitor point (disabled by default)
Diagnostic Steps
- Check Connection Status - Monitor connection indicators on main interface
- Review Packet Counters - Good/Bad packet statistics show communication health
- Verify Settings - Double-check all configuration parameters
- Test Simple Configuration - Start with basic TCP/IP connection before advanced setups
- Check Error Codes - Reference Error Codes Page
Support Resources
- Email: support@quantumbitsolutions.com
- Documentation: docs.quantumbitsolutions.com
- Forum: Expert community
Modbus Ecosystem & Complementary Tools
Understanding the broader Modbus tool ecosystem helps you choose the right tool for each task. Modbus Monitor Advanced excels at mobile field monitoring with integrated sensor capabilities, but other tools serve complementary roles in mixed workflows.
Strategic Tool Selection
These tools are part of the Modbus testing and automation ecosystem. We list them to help you understand when each tool fits best and why Modbus Monitor Advanced remains the optimal choice for mobile industrial monitoring and on-site diagnostics.
Tool Comparison
| Tool | Category | Best Use Case | Why Choose Modbus Monitor Advanced |
|---|---|---|---|
| Modbus Monitor Advanced | Android Mobile, Professional | Field monitoring + sensor integration + cloud publishing | Mobile access, sensor server mode, integrated IoT workflows, real-time diagnostics |
| Modbus Monitor XPF | Windows Desktop | Desktop monitoring with multi-channel operations | Advanced combines mobile + desktop companion; XPF for stationary HMI setups |
| QModMaster | Cross-platform GUI | Manual frame testing on Linux/macOS workstations | Advanced offers mobile access, logging, cloud integration, sensor exposure |
| ModScan | Windows Traditional | Legacy Windows workflows, quick register scanning | Advanced provides modern Android UI, mobile deployment, IoT integration |
| pymodbus / modbus-tk | Python Libraries | Automated test scripts, CI/CD integration | Advanced for field visualization, non-coding technicians, instant mobile access |
When to Use Each Tool
Modbus Monitor Advanced
- On-site diagnostics with Android phone/tablet
- Sensor Server Mode (accelerometer, gyroscope, GPS, etc.)
- Real-time cloud publishing (ThingSpeak, MQTT, Google Sheets)
- Multi-protocol support (TCP, RTU, ASCII, UDP, Bluetooth, USB-OTG)
- Portable field testing without laptop
Why choose this: Purpose-built for mobile industrial environments, sensor integration, and on-site commissioning
Modbus Monitor XPF [Windows]
- Stationary HMI and control room monitoring
- Multi-channel concurrent polling
- Advanced data transformations
Complementary use: Deploy Advanced for field work, XPF for control room dashboards
Why Advanced is better for field: Mobile access, no PC required, integrated sensors
QModMaster [Open Source]
- Manual frame construction for development
- Cross-platform (Linux, macOS, Windows)
- Basic read/write operations
Limitation: Desktop-only, no mobile access, no sensor integration, no cloud publishing
Use Modbus Monitor Advanced for: Field deployment, production monitoring, mobile access, sensor data
ModScan [Commercial Windows]
- Traditional Windows interface
- Established in industrial settings
- Register scanning utilities
Modbus Monitor Advanced advantage: Mobile deployment, modern Android UI, sensor server, IoT integration
pymodbus / modbus-tk [Python]
- Custom automation scripts
- CI/CD test integration
- Embedded device testing
Complementary use: Python scripts simulate devices; Modbus Monitor Advanced validates in field
Complementary Workflows
Scenario 1: Development to Deployment
Scenario 2: Multi-Platform Teams
Scenario 3: Sensor Integration
Frequently Asked Questions
What is the best Modbus monitoring tool for Android?
Modbus Monitor Advanced is the premier Android Modbus solution with professional features including:
- Client Mode (poll remote devices)
- Server Mode (phone as Modbus slave)
- Sensor Server Mode (expose phone sensors via Modbus)
- Multi-protocol support (TCP, RTU, ASCII, UDP, Bluetooth, USB-OTG)
- Cloud integration (ThingSpeak, Google Sheets, MQTT)
- Real-time logging and statistics
For desktop-only workflows on Linux/macOS, QModMaster offers basic testing capabilities.
How does Modbus Monitor Advanced differ from QModMaster?
While QModMaster is useful for basic manual testing on desktop, Modbus Monitor Advanced adds:
- Mobile deployment: Android phone/tablet field access
- Sensor Server Mode: Expose accelerometer, gyroscope, GPS as Modbus registers
- Cloud integration: Real-time publishing to ThingSpeak, Google Sheets, MQTT
- Advanced logging: CSV export with timed intervals, email sharing
- Multi-protocol: Bluetooth, USB-OTG, in addition to TCP
- Professional support: Documentation, updates, expert assistance
QModMaster is desktop-only for manual testing; Modbus Monitor Advanced is built for mobile field operations.
Can I use Modbus Monitor Advanced with Modbus Monitor XPF?
Absolutely! Many users deploy both:
- XPF for stationary control room monitoring and multi-channel dashboards
- Advanced for field technicians doing commissioning and on-site diagnostics
Both can connect to the same devices, or use Advanced as a Modbus server that XPF polls for sensor data.
Can I use Python libraries with Modbus Monitor Advanced?
Yes! Common integration patterns:
- Validation: Run
pymodbusautomation scripts, use Advanced to verify field behavior - Sensor client: Use Advanced Sensor Server Mode to expose phone sensors; poll with pymodbus for data collection
- Device simulation: Python scripts simulate Modbus devices; Advanced validates responses
This keeps automation logic in code while providing mobile visualization and field diagnostics.
Should I use ModScan or Modbus Monitor Advanced for field work?
Modbus Monitor Advanced is purpose-built for field deployment:
- No laptop requiredruns on Android phone/tablet
- Sensor integration (measure vibration, orientation, location)
- Cloud publishing for remote team visibility
- Bluetooth and USB-OTG for serial devices
- Portable and rugged (use industrial Android tablets)
ModScan requires Windows laptop and lacks sensor/mobile capabilities. Use Advanced for field work, ModScan only for legacy desktop workflows.
Are these tools compatible with each other?
Yes! All speak standard Modbus protocol:
- Use Modbus Monitor Advanced as Server Mode; poll with QModMaster or XPF for verification
- Run pymodbus scripts writing to devices; monitor with Advanced from mobile
- Test configurations in QModMaster desktop; deploy production monitoring with Advanced mobile
- Use Advanced Sensor Server Mode; poll with pymodbus or XPF for sensor data collection
My USB Serial Port is not working; what should I do?
USB-OTG connectivity requires several checks:
Prerequisites: - Device must support USB-OTG (not all phones/tablets have this hardware) - You must use a proper USB-OTG cable, not a standard USB cable - See Android Hardware Guide for approved cables and adapters
Troubleshooting Steps:
-
Exit and restart the app after plugging in USB cable. On first connection, Android selects which app has access to the serial port. The app needs a second launch to properly detect the driver.
-
Verify USB-OTG hardware support: Test with free Android utilities:
- Easy OTG Checker (Google Play) - Check if your device supports USB-OTG
- FTDI Android App (Google Play) - For FTDI-type dongles
-
Prolific Android App - For Prolific-type serial adapters
-
Check USB cable quality: Poor-quality USB-OTG cables are a common cause. Verify with Easy OTG Checker; if it shows "not good," the cable needs replacement.
-
Grant app permissions: When you plug in the USB device, a permission dialog appears asking you to select which app has access. Select "Modbus Monitor Advanced" explicitly.
-
Verify driver compatibility: Confirm your USB-to-serial adapter is compatible (FTDI, Prolific, or SiLab chips are most reliable).
-
Check for rooting/manufacturer restrictions: Some manufacturers disable USB-OTG even when Android supports it. If all utilities show "good" but it still doesn't work, contact the device manufacturer.
What is a Modbus (TCP) Server?
A Modbus TCP Server is a Modbus slave device that listens for incoming TCP/IP connections and serves data to clients that request it.
Key Facts: - Only protocol used is Modbus TCP (TCP/IP format) - Standard port is 502, but that's locked on Android - Android requires ports > 1024 (unless device is rooted) - Recommended testing port: 8888 - Your Modbus controller device must connect to the same port you configure - You can use the same monitor point configuration as Client Mode
See the Server Mode section of this guide for detailed configuration steps.
What can I do with Modbus (TCP) Server Mode?
Server Mode enables several professional workflows:
1. Test and Validate Your Setup - Use two phones: one in Master (Client) mode, one in Server mode - Have them talk to each other to test configuration, addresses, and data types - Great for learning and troubleshooting without external equipment
2. Extract Sensor Data from Your Phone - Read phone sensors remotely via Modbus TCP: GPS location, orientation, light sensor, accelerometer, gyroscope, barometer, etc. - Connect your Modbus controller to your phone's Sensor Server to receive real-time sensor data - Perfect for mobile data collection and IoT applications
3. Multi-Platform Monitoring - Run Server Mode on tablet/minicomputer - Have desktop apps (XPF, QModMaster) or other devices poll your Android server - Enables remote monitoring via Modbus TCP without additional hardware
Port Conflict Check: Ensure no other apps are using your selected port. Test with ports 8888, 9999, or 5020 first.
See the Sensor Server feature section for sensor-specific applications.
What is Sensor Server?
Sensor Server is an extension of Server Mode that turns your Android device into a portable Modbus TCP server publishing sensor data.
What It Does: - Converts Android device sensors into Modbus TCP registers - Clients can poll your phone/tablet remotely to read sensor values - Sensor types: GPS (latitude/longitude/altitude), light, accelerometer (X/Y/Z), gyroscope, barometer, etc. - Raw sensor data is automatically stuffed into 6 consecutive Modbus TCP registers
Common Applications: - Mobile asset tracking: GPS-enabled monitoring points for vehicles/equipment - Environmental monitoring: Light and pressure sensors for facility management - Motion detection: Accelerometer and gyroscope for vibration analysis - Sensor research: Validate sensor data before production deployment - IoT prototyping: Quickly add Android sensor data to industrial workflows
No Extra Purchase Required: This feature is included with Modbus Monitor Advanced; no additional add-ons needed.
For detailed setup and examples, see Sensor Server Mode section.
External Resources
Third-Party Modbus Tools
We provide these links for ecosystem awareness and complementary workflows. We are not affiliated with these projects.
- Modbus Monitor XPF - Professional Windows desktop monitoring
- QModMaster GitHub - Cross-platform open source GUI
- pymodbus Documentation - Python Modbus library
- modbus-tk GitHub - Alternative Python library
Glossary
| Term | Definition |
|---|---|
| Monitor Point | A complete configuration object defining how to read/write one Modbus data item (address, count, data type, channel, scaling, units). |
| Holding Register | Read/Write 16-bit register range (400001+ in six-digit format, FC3 for reads, FC6/16 for writes). |
| Input Register | Read-only 16-bit register range (300001+ in six-digit format, FC4). |
| Coil | Single-bit read/write output (000001+ six-digit, FC1 read / FC5 write / FC15 multiple). |
| Discrete Input | Single-bit read-only input (100001+ six-digit, FC2). |
| Slave ID / Unit ID | Address of a Modbus server device on serial or logical network (1–247 typical). |
| Count | Number of consecutive 16-bit registers requested; float32 = 2, int16 = 1, double64 = 4. |
| Data Type | Interpretation layer converting raw registers into value (INT16U, FLOAT32, STRING, etc.). |
| Endian / Swap | Byte/word order arrangement for multi-register types; configured via Swap (e.g., ABCD_BE, CDAB_LEBS). |
| Sensor Server | Feature exposing Android sensor readings as Modbus TCP registers automatically. |
| Write Function | Selected Modbus function for sends (single/multiple coil/register) controlling permissible operations. |
| Batch Publishing | MQTT mode sending array of point objects in single JSON message (modbus/<deviceId>/batch). |
| Delta Publishing | Planned feature to publish only changed values since last cycle to reduce bandwidth. |
| Six-Digit Addressing | Address format embedding function code prefix (e.g., 400001) for unambiguous register targeting. |
| Preset Value | Pre-configured write value sent instantly with Write Preset action for quick control. |
| Scaling (Linear) | Range conversion formula mapping raw counts (e.g., 0–65535) to engineering limits (e.g., 0–100 PSI). |
| Gain/Offset | y = m x + b linear transform for calibration or unit conversion. |
| Server Mode | Device responds to Modbus TCP requests; values stored in app memory. |
| Client Mode | Device polls remote Modbus servers/slaves to read (and optionally write) data. |
| Address Collision | Overlapping address ranges across monitor points leading to unintended overwrites (avoid by spacing). |
Ready for serious industrial communication work on Android devices.