Modbus Mapper Pro - Quick Start Guide
Get up and running with Modbus traffic analysis in minutes
Getting Started
System Requirements
- Computer: Windows 10 or Windows 11
- Connection: USB-to-RS485 adapter (about $15-30 online)
- That's it! Nothing else needed
Optional: A physical RS485 cable "tap" if you want to spy on existing cables without disconnecting them.
Installation Options
Pick One Way to Get It:
Option 1: Download & Extract (Easiest)
- Go to QuantumBitSolutions.com
- Click Download
- Extract the file
- Click the .exe to run it
- Done! No installation hassles.
First Time?
The first time you run it, it might take a few seconds to set itself up. That's normal.
Option 2: Microsoft Store (For IT Teams)
- Open Microsoft Store on your computer
- Search for "Modbus Mapper Pro"
- Click Install
- Find it in your Start Menu
- Done!
Quick Setup
For older systems and embedded PCs:
For modern Windows systems:
For managed environments:
Step 1: Installation and Launch
After downloading and extracting the application:
- Extract files to your desired location (portable - no installation needed)
- Connect your RS485 adapter to your Modbus RTU network
- Launch the application by running the executable
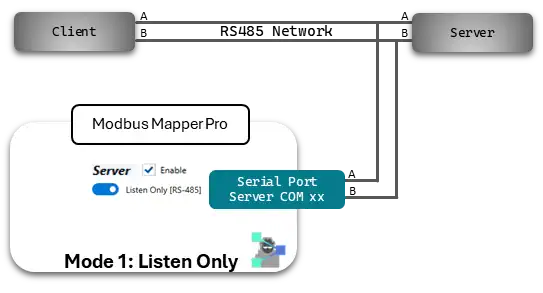
Step 2: Choose Your Operating Mode
For this quick start guide, we'll use Mode 1 - Listen Only — it's the safest and easiest way to start.
- Click the Mode Button (bottom right of the application)
- Select Listen Only mode
- You're ready to connect!
Other Modes
Once you're comfortable, explore Mode 2 (Pass-Through) and Mode 3 (Multiplex) — see User Manual: Operating Modes for details. Note: These modes require network reconfiguration.
Step 3: Connect Your RS485 Adapter & Start Listening
What You're Doing
You're tapping into the RS485 cable (like plugging in a phone to hear a conversation without being part of it).
How to Connect
Find your RS485 cable: - Usually 2 wires going to Modbus devices - Often labeled A and B (or sometimes ± or D+/D-) - Also find the Ground wire
Connect your adapter:
Existing RS485 Cable          Your USB Adapter
    A ─────────────────────────→ A
    B ─────────────────────────→ B
   GND ─────────────────────────→ GND

Plug adapter into your computer USB port
Important
Don't disconnect anything. Just tap in. You're only listening, not interrupting.
Software Setup
-
Pick COM Port
- Plug in the USB adapter
- In Mapper Pro, select which COM port it's using
- (Check Windows Device Manager if unsure — look for COM3, COM4, etc.)
-
Set Speed (Baud Rate)
- Ask your device manager what baud rate your system uses
- Common ones: 9600, 19200, 38400
- Pick from the dropdown
-
Configure Server Settings
- Server: ✅ Enable
- Port: COM15 (depends on your adapter)
- Baud: 19200 (check your device documentation)
- Parity: None (typical)
- Data Bits: 8 (typical)
- Stop Bits: 1 (typical)
- Listen Only [RS-485]: ON
-
Click "Start" to begin monitoring
-
Mapper Pro is now capturing all Modbus traffic
Within seconds, you'll see:
- ✅ Devices talking
- ✅ All the data they exchange
- ✅ Register addresses
- ✅ Data values in readable format
Step 4: See What Your Devices Are Doing
Once monitoring starts, you'll see three main views:
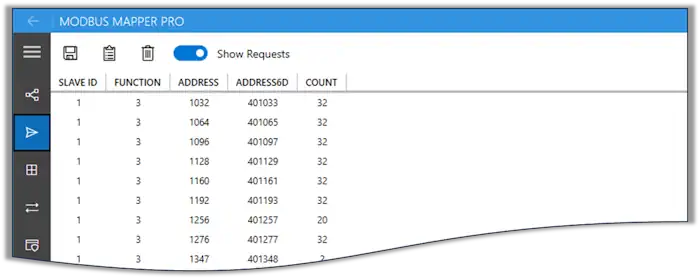
Client Requests View — "What Are They Asking For?"
Shows every question being asked to devices:
| Field | Description | Example |
|---|---|---|
| Slave ID | Modbus device address being queried | 1, 17 |
| Function | Modbus function code of the request | 03 Read Holding Registers, 04 Read Input Registers, 16 Write Multiple Registers |
| Address | Modbus Base register/coil address in standard format | 40001, 30001, 00001 |
| Address6D | 6-digit addressing format for clarity and consistency | See guide: 6-Digit Addressing |
| Count | Number of registers/coils requested | 1, 2, 10 |
What to notice: If you see 100+ different requests, that's normal. Devices are busy!
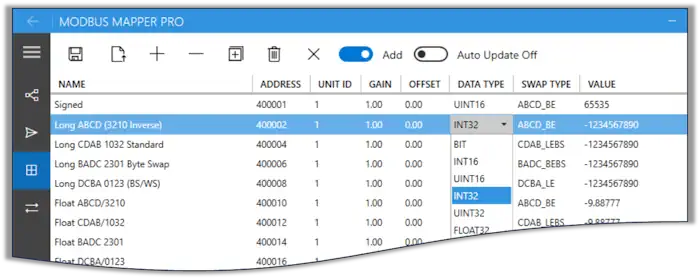
Modbus Map (Data View) — "What Are The Values?"
This view lets you transform raw Modbus registers into meaningful values. Use data type, byte swap, gain, and offset to convert readings into human-friendly units (similar to Modbus Monitor XPF).
| Control | Purpose |
|---|---|
| Save | Export the Modbus Map to CSV for use in other tools (e.g., Modbus Monitor XPF) |
| Open | Load a previously saved Modbus Map (local or exported from XPF) |
| + (Add) | Add a monitoring point for an address to apply post-processing |
| - (Remove) | Remove the selected monitoring point from the list |
| [[+]] (Add All) | Automatically add monitoring points for newly discovered requests |
| Delete | Clear all monitoring points from the current map |
| Add | Automatically add or update values from client responses |
| Auto Update | Periodically refresh values from internal captured memory |
- Click "Create Map" or "Add All"
- All discovered data appears as a table (like Excel)
- Each row shows one piece of data with its current value
-
Change the name to something meaningful:
- Change "Register 100" to "Temperature"
- Change "Register 101" to "Pressure"
- Check the "Auto Update" box to watch values change in real-time
Example:
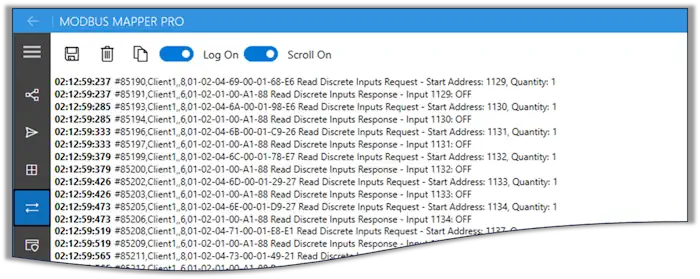
Messages/Logs Tab — "What's Happening Right Now?"
This tab shows live raw traffic captured in all modes. Use it to verify requests/responses, spot errors, and understand timing.
| Control | Purpose |
|---|---|
| Save | Save the traffic log to a file for later analysis |
| Delete | Clear the current log entries |
| Log On | Toggle logging visibility (show/hide traffic) |
| Scroll | Enable auto-scroll to keep the latest messages in view |
Pro tip: Turn on "Auto Scroll" so new messages appear at the bottom automatically.
Shows every single message:
- Raw data that was sent
- Raw response that came back
- What it all means in English
- When it happened (timestamp)
Use this for: Understanding problems, seeing errors, timing analysis
Step 5: Save Your Discoveries
Once you've built your Modbus map:
- Save the map for documentation purposes.
- Copy data to clipboard for sharing
- Export configuration for use in other applications (Modbus Map View - Save)
- Use with Modbus Monitor XPF for active monitoring and control
Troubleshooting
Common First-Time Issues
No Traffic Detected
Causes & Solutions: - Wrong COM port → Check Device Manager for correct port - Wrong baud rate → Try common rates: 9600, 19200, 38400 - Bad connections → Verify A/B wiring and ground - Network inactive → Ensure HMI is actually polling
Garbled Data
Causes & Solutions:
- Wrong baud rate → Match network settings exactly
- Wrong parity/stop bits → Check network configuration
- Electrical interference → Improve cable routing/shielding
- Ground loops → Isolate monitoring connection
Partial Capture
Causes & Solutions: - High traffic volume → Increase buffer settings - USB adapter limitations → Use industrial-grade adapter - Timing issues → Adjust capture timing parameters
What's Next?
Immediate Actions
- Document discoveries - Export captured register maps
- Identify patterns - Note polling frequencies and sequences
- Validate findings - Cross-reference with known system behavior
Advanced Usage
- Set up continuous monitoring for long-term analysis
- Compare before/after system changes
- Export data for inclusion in system documentation
- Share findings with team members
Need More Help?
- 📖 Complete User Manual - Detailed feature guide
- 🎥 Video Tutorials - Visual step-by-step guides
- 📧 Support - Email assistance for licensed users
- 💬 Community - User forum for tips and discussions
In 10 minutes, you should be successfully monitoring Modbus traffic and discovering register maps!