Modbus Monitor XPF - Quick Start
5-Minute Setup Guide
Get started with Modbus Monitor XPF in just 5 minutes! Perfect for first-time users.
🎯 What You'll Accomplish
By the end of this guide, you'll have:
✅ **Installed** Modbus Monitor XPF
✅ **Connected** to your first Modbus device
✅ **Monitored** real-time data
✅ **Configured** basic monitoring points
⚡ Step 1: Install XPF (2 minutes)
- Open Microsoft Store on Windows
- Search for "Modbus Monitor XPF"
- Click Install
- Launch from Start Menu
- Visit Download Page
- Download executable file
- Run the downloaded file
- Start using immediately (portable version)
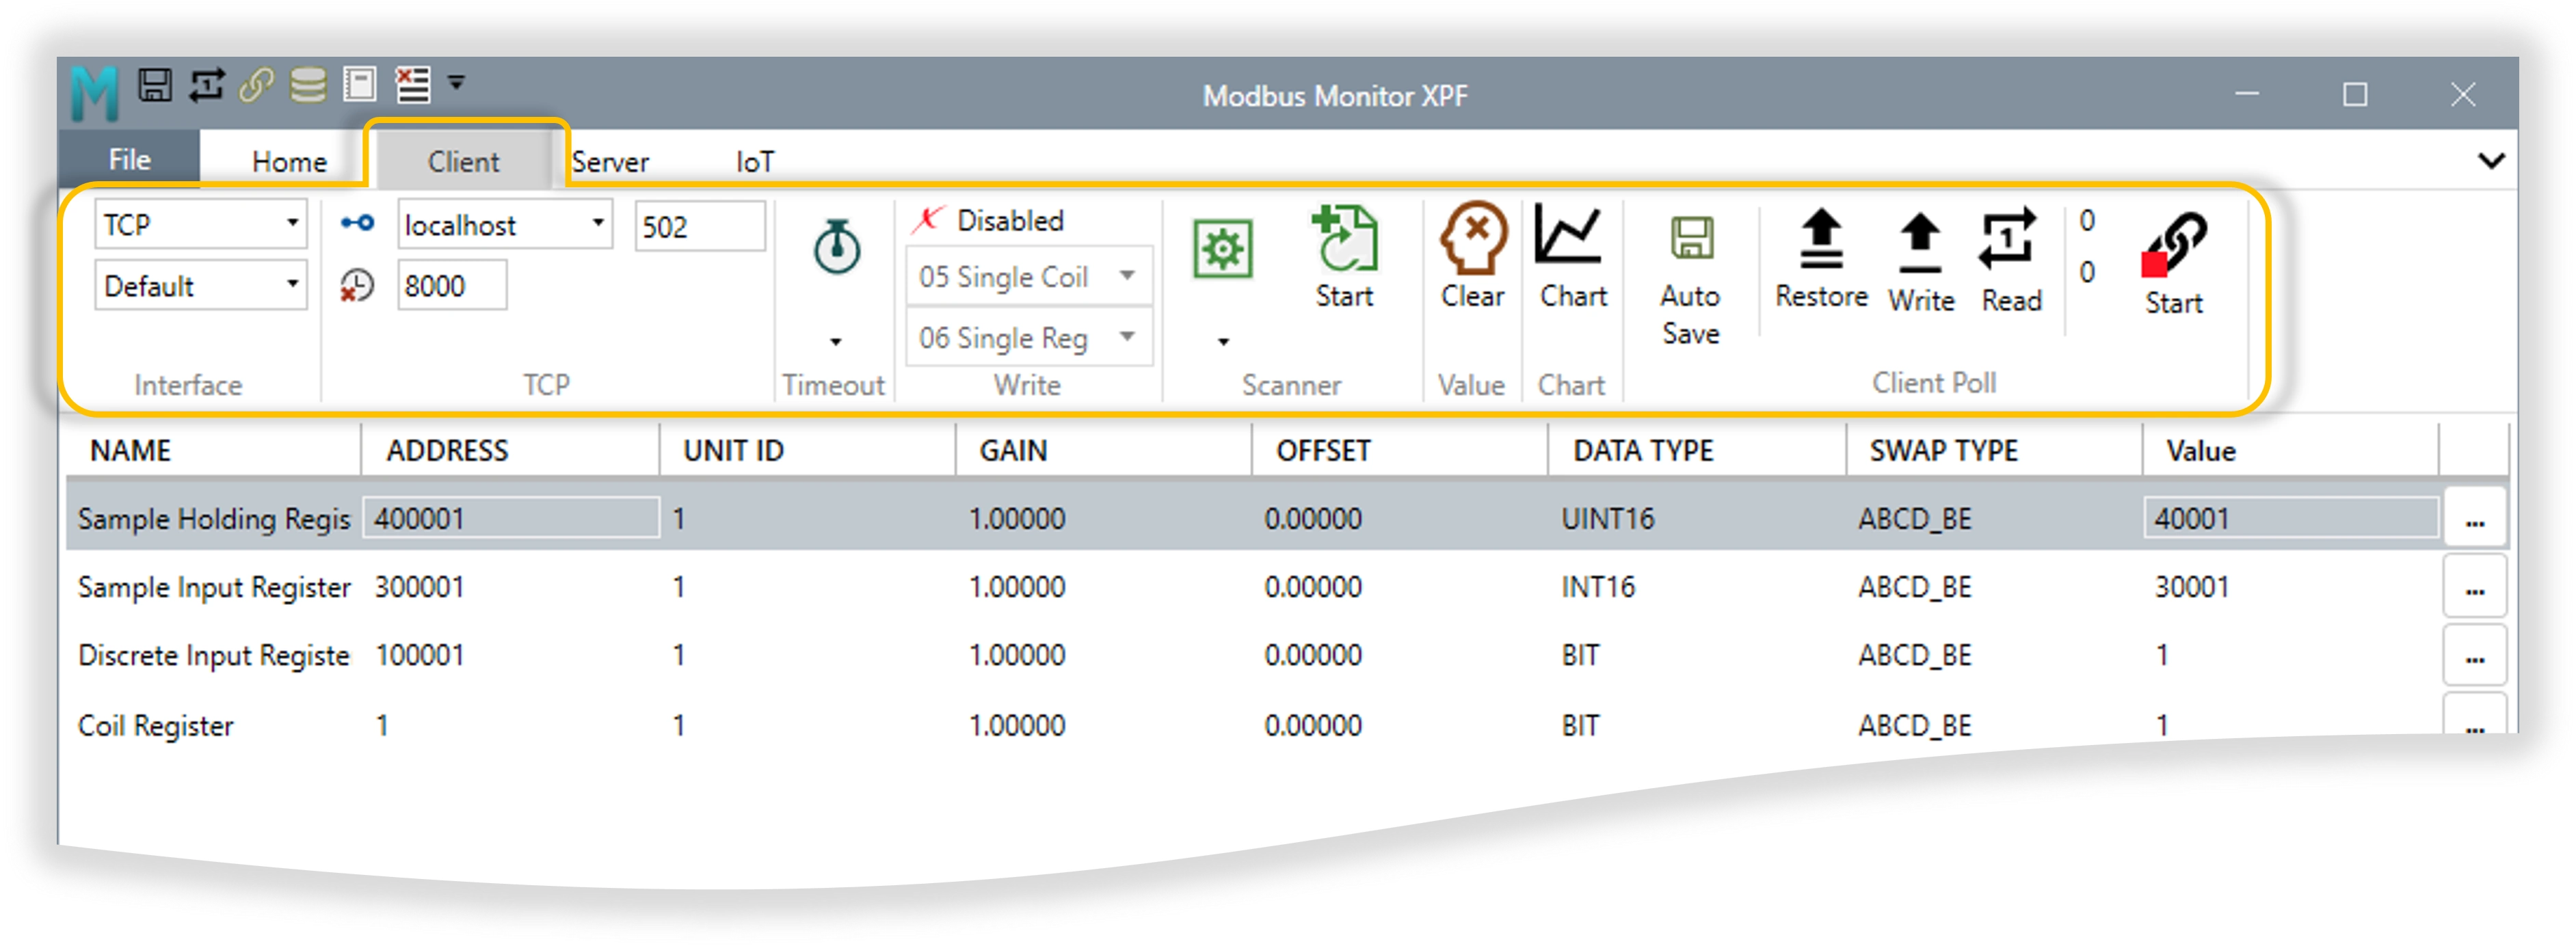
🔌 Step 2: First Connection (2 minutes)
For TCP/IP Devices
- Go to Client tab in XPF ribbon
- Set Interface to "TCP"
- Enter IP Address of your Modbus device (e.g.,
192.168.1.100) - Set Port to
502(standard Modbus port) - Click Start button
For Serial Devices
- Go to Client tab in XPF ribbon
- Set Interface to "Serial"
- Select COM Port (e.g., COM1, COM3)
- Configure baud rate (typically 9600 or 19200)
- Click Start button
📊 Step 3: Add Monitor Points (1 minute)
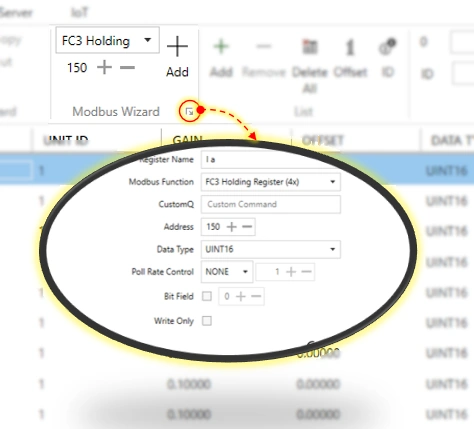
Using the Modbus Wizard (Recommended)
- Click "Modbus Wizard" in Home tab
- Select "Add new monitor point"
- Choose Modbus function:
- Holding Registers (most common) - Function 3
- Input Registers - Function 4
- Coils - Function 1
- Discrete Inputs - Function 2
- Enter starting address (e.g., 40001)
- Click OK
Manual Entry (Alternative)
| Field | Example Value | Description |
|---|---|---|
| Name | Temperature Sensor | Descriptive name |
| Address | 400001 | First holding register |
| Unit ID | 1 | Slave device ID |
| Data Type | INT16 | 16-bit signed integer |
✅ Step 4: Monitor Live Data
- Click Start button (chain link icon) in Client tab
- Watch the Value column update with live data
- Green values = successful reads
- Red borders = communication errors
🚀 Quick Success Checklist
- Connection Status: No red borders in Value column
- Live Updates: Values changing/updating regularly
- Correct Data: Values make sense for your device
- Stable Communication: No timeout errors
🔧 Common Quick Fixes
"Connection Refused" Error
- ✅ Check IP Address: Verify device IP is correct
- ✅ Check Port: Ensure port 502 is correct
- ✅ Network: Ping the device IP address
- ✅ Firewall: Temporarily disable Windows firewall
"Timeout" Errors
- ✅ Increase Timeout: Go to Client tab → Timeout → set to 5000ms
- ✅ Check Cables: Verify physical connections
- ✅ Device Power: Ensure Modbus device is powered on
Wrong Values Displayed
- ✅ Check Data Type: Try UINT16 instead of INT16
- ✅ Check Swap Type: Try different byte order options
- ✅ Verify Address: Confirm register addresses with device manual
Serial Port Issues
- ✅ COM Port: Verify correct port in Device Manager
- ✅ Baud Rate: Match device configuration (9600, 19200, etc.)
- ✅ Parity/Stop Bits: Match device settings exactly
🎉 What's Next?
Now that you have basic monitoring working:
Immediate Next Steps
- 📊 Add More Points - Monitor additional registers
- 📈 Enable Charting - See data trends over time
- 💾 Save Configuration - Preserve your setup
- 🧩 Use HMI Widgets - Build HMI dashboard layouts
- 📘 Widget Reference - Configure all 15 widgets
Advanced Features to Explore
- 🧙♂️ Advanced Wizard - Complex configurations
- 🌐 Online Maps - Download pre-built device maps
- 🖥️ Server Mode - Simulate Modbus devices
- 📝 Logging & Export - Data analysis and reporting
Get Help
- 📖 Complete User Guide - Comprehensive documentation
- 🎥 Video Tutorials - Step-by-step videos
- 💬 Community Forum - Ask questions and get help
🎯 Common Use Cases
Industrial Monitoring
Scenario: Monitor PLC data
Address: 400001-400010
Data: Production counters, temperatures, pressures
Update Rate: Every 1 second
Energy Management
Scenario: Power meter monitoring
Address: 300001-300020
Data: Voltage, current, power, energy
Update Rate: Every 5 seconds
Building Automation
Scenario: HVAC system monitoring
Address: 400100-400150
Data: Temperature setpoints, valve positions
Update Rate: Every 30 seconds
Pro Tip
Start simple! Get one register reading successfully, then add more complexity. The Modbus Wizard makes it easy to add points without manual address calculation.
🎉 Congratulations! You've successfully set up Modbus Monitor XPF and are monitoring live data. You're now ready to explore the advanced features and customize your monitoring solution.